Crypto Today: Bitcoin shows signs of weakness as Ethereum, XRP pare losses amid US Dollar resurgence
- Bitcoin struggles to reclaim the $109,000 level amid a rebound in the US Dollar Index above 97.00.
- Ethereum steadies recovery, eyeing a breakout above $2,600 in upcoming sessions.
- XRP uptrend stalls but remains above key moving averages, indicating a robust technical structure.

Cryptocurrency prices are relatively stable on Monday, with Bitcoin (BTC) holding below $109,000. An attempt made over the weekend failed to break through the round-figure psychological resistance at $110,000, leaving last week's peak of $110,530 untested. Bitcoin continues to face downside risk as the US Dollar Index (DXY), which tracks the Greenback’s value against six major currencies, rebounds above 97.00.
Meanwhile, the largest altcoin by market capitalization, Ethereum (ETH), exhibits resilience, aiming for a breakout above $2,600 in upcoming sessions. On the other hand, Ripple (XRP) is struggling to maintain its weekend gains, trading at around $2.27 at the time of writing.
Market overview: What next for Bitcoin as US Dollar Index ticks up
The US Dollar Index is making a comeback, currently hovering at around 97.41 after falling to 96.92, a level last seen in February 2022. Multiple macroeconomic factors have led the DXY to plunge nearly 13% this year alone.
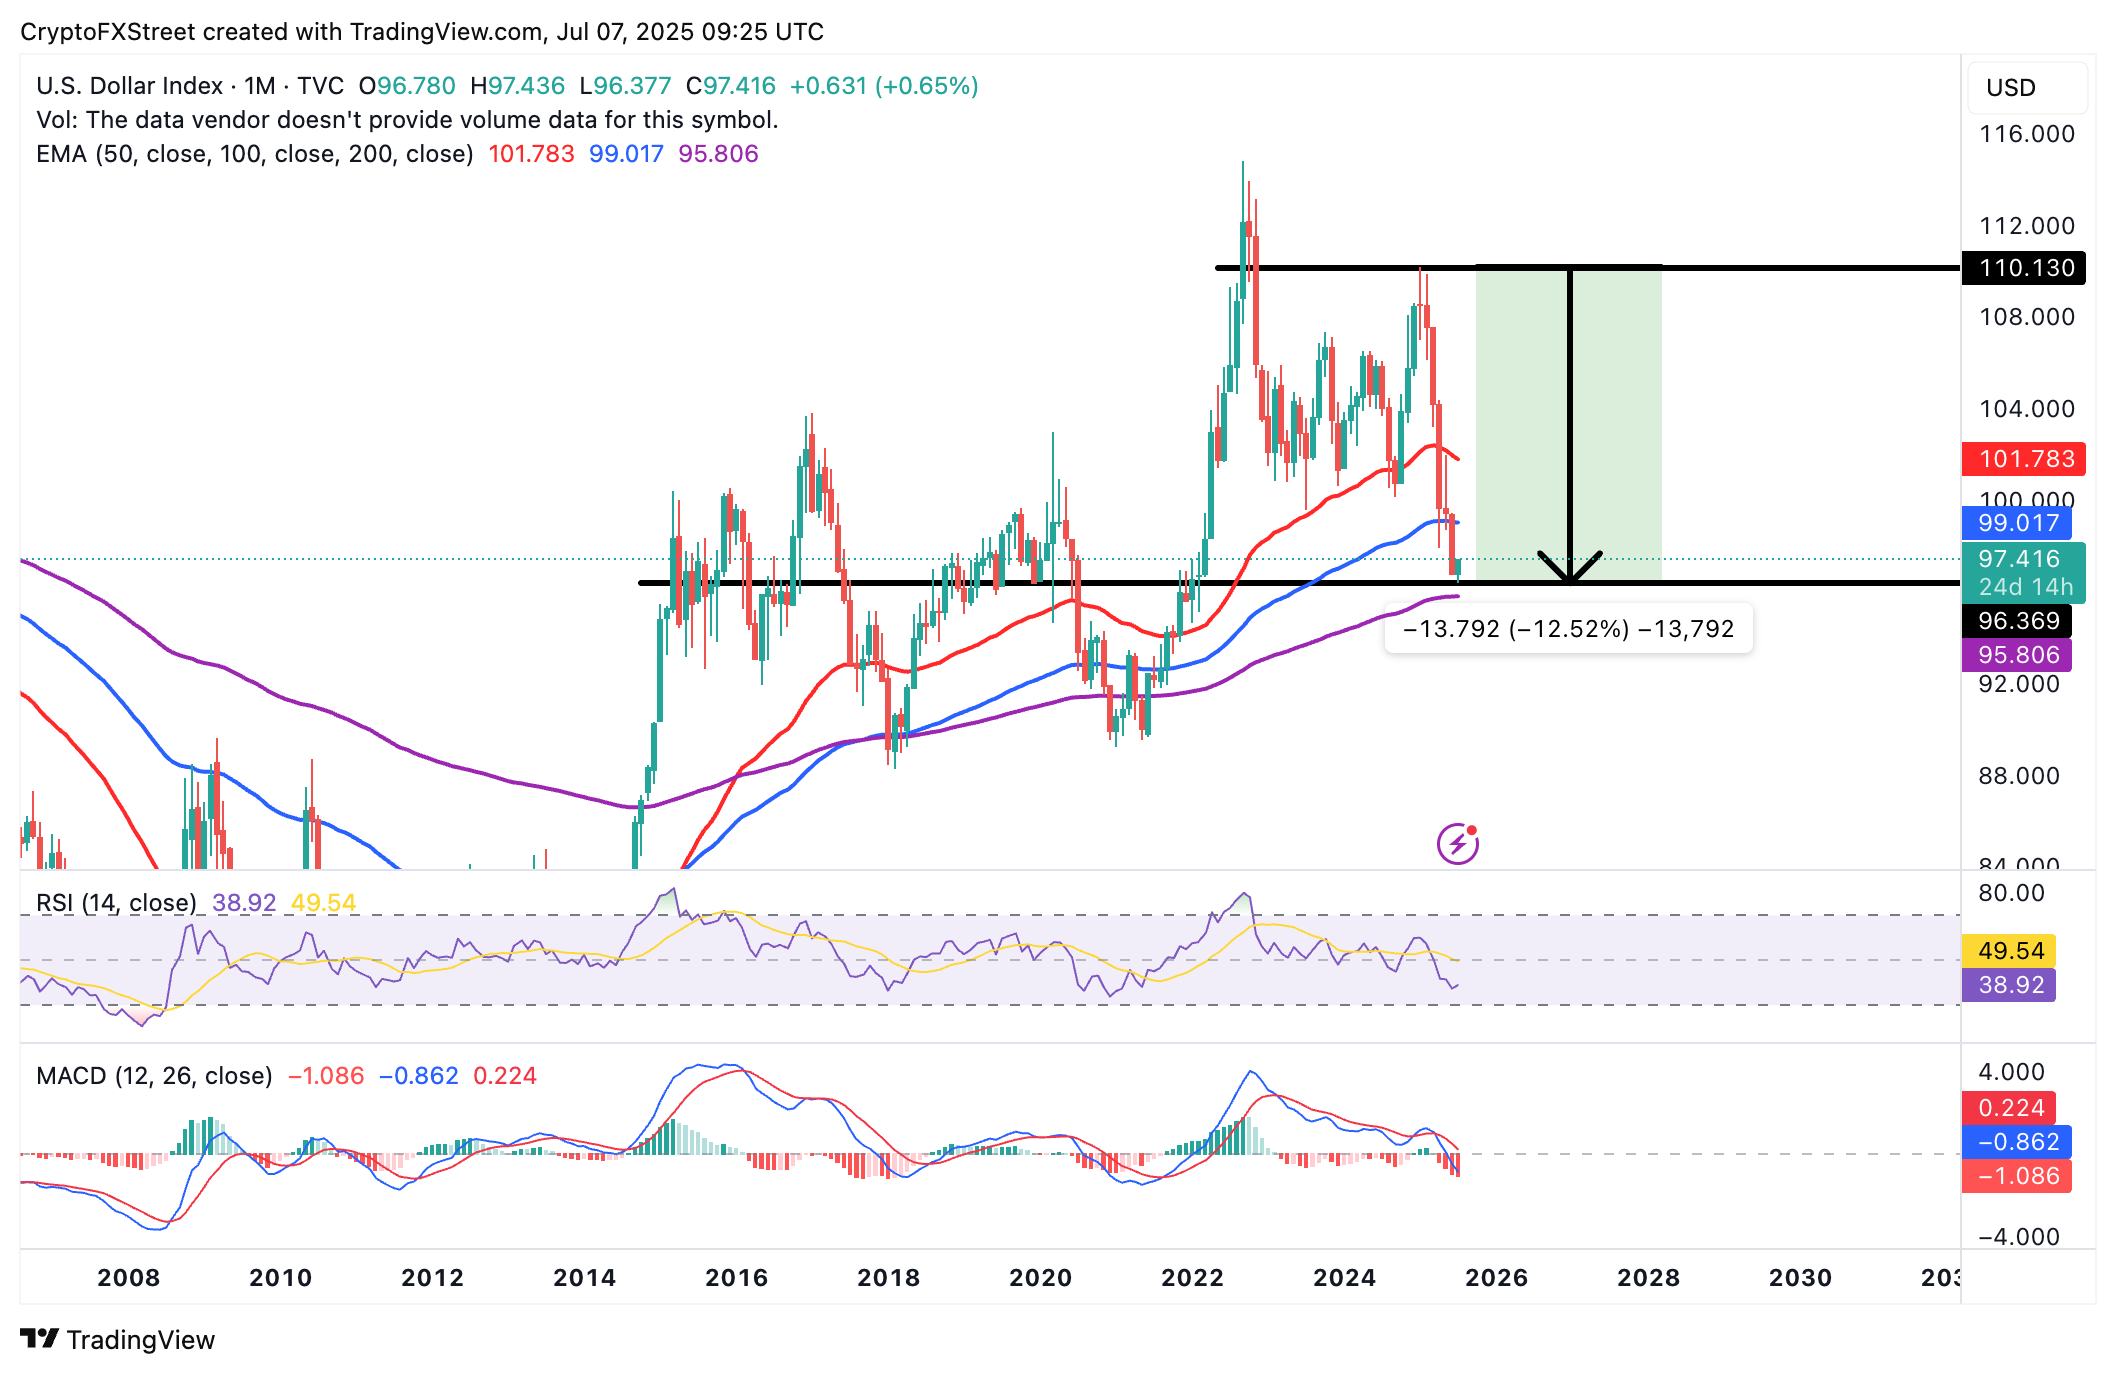
DXY monthly chart
The decline can be attributed, among other factors, to US President Donald Trump's tariffs imposed in April and the ongoing geopolitical tensions in the Middle East.
Investors are increasingly concerned about the sustainability of the US national debt, which continues to rise, reaching over $36 trillion this year. The US President's planned tax cuts are projected to add up to $5 trillion to the national debt, according to a recent report by Al Jazeera.
The rise of the Dollar index above 97.00 comes amid renewed tariff talks. President Trump has hinted at a 10% tariff on all countries affiliated or allied with the BRICS economic movement.
Chart of the day: Bitcoin could extend the decline
Bitcoin's price hovers at around $108,813 at the time of writing, weighed down by market indecision as traders tread cautiously, digesting perceived macroeconomic risks surrounding tariffs.
The Relative Strength Index (RSI) on the daily chart, although above the midline, is pointing slightly downward.
Traders should monitor price movement above the $109,000 level to ascertain the bullish outlook toward the $110,000 round-figure psychological resistance.
The Moving Average Convergence Divergence (MACD) indicator has maintained a buy signal since June 25, which could be helping to stabilize the price of Bitcoin. As the blue MACD line remains above the red signal line, risk sentiment could steady the price ahead of the next breakout attempt.
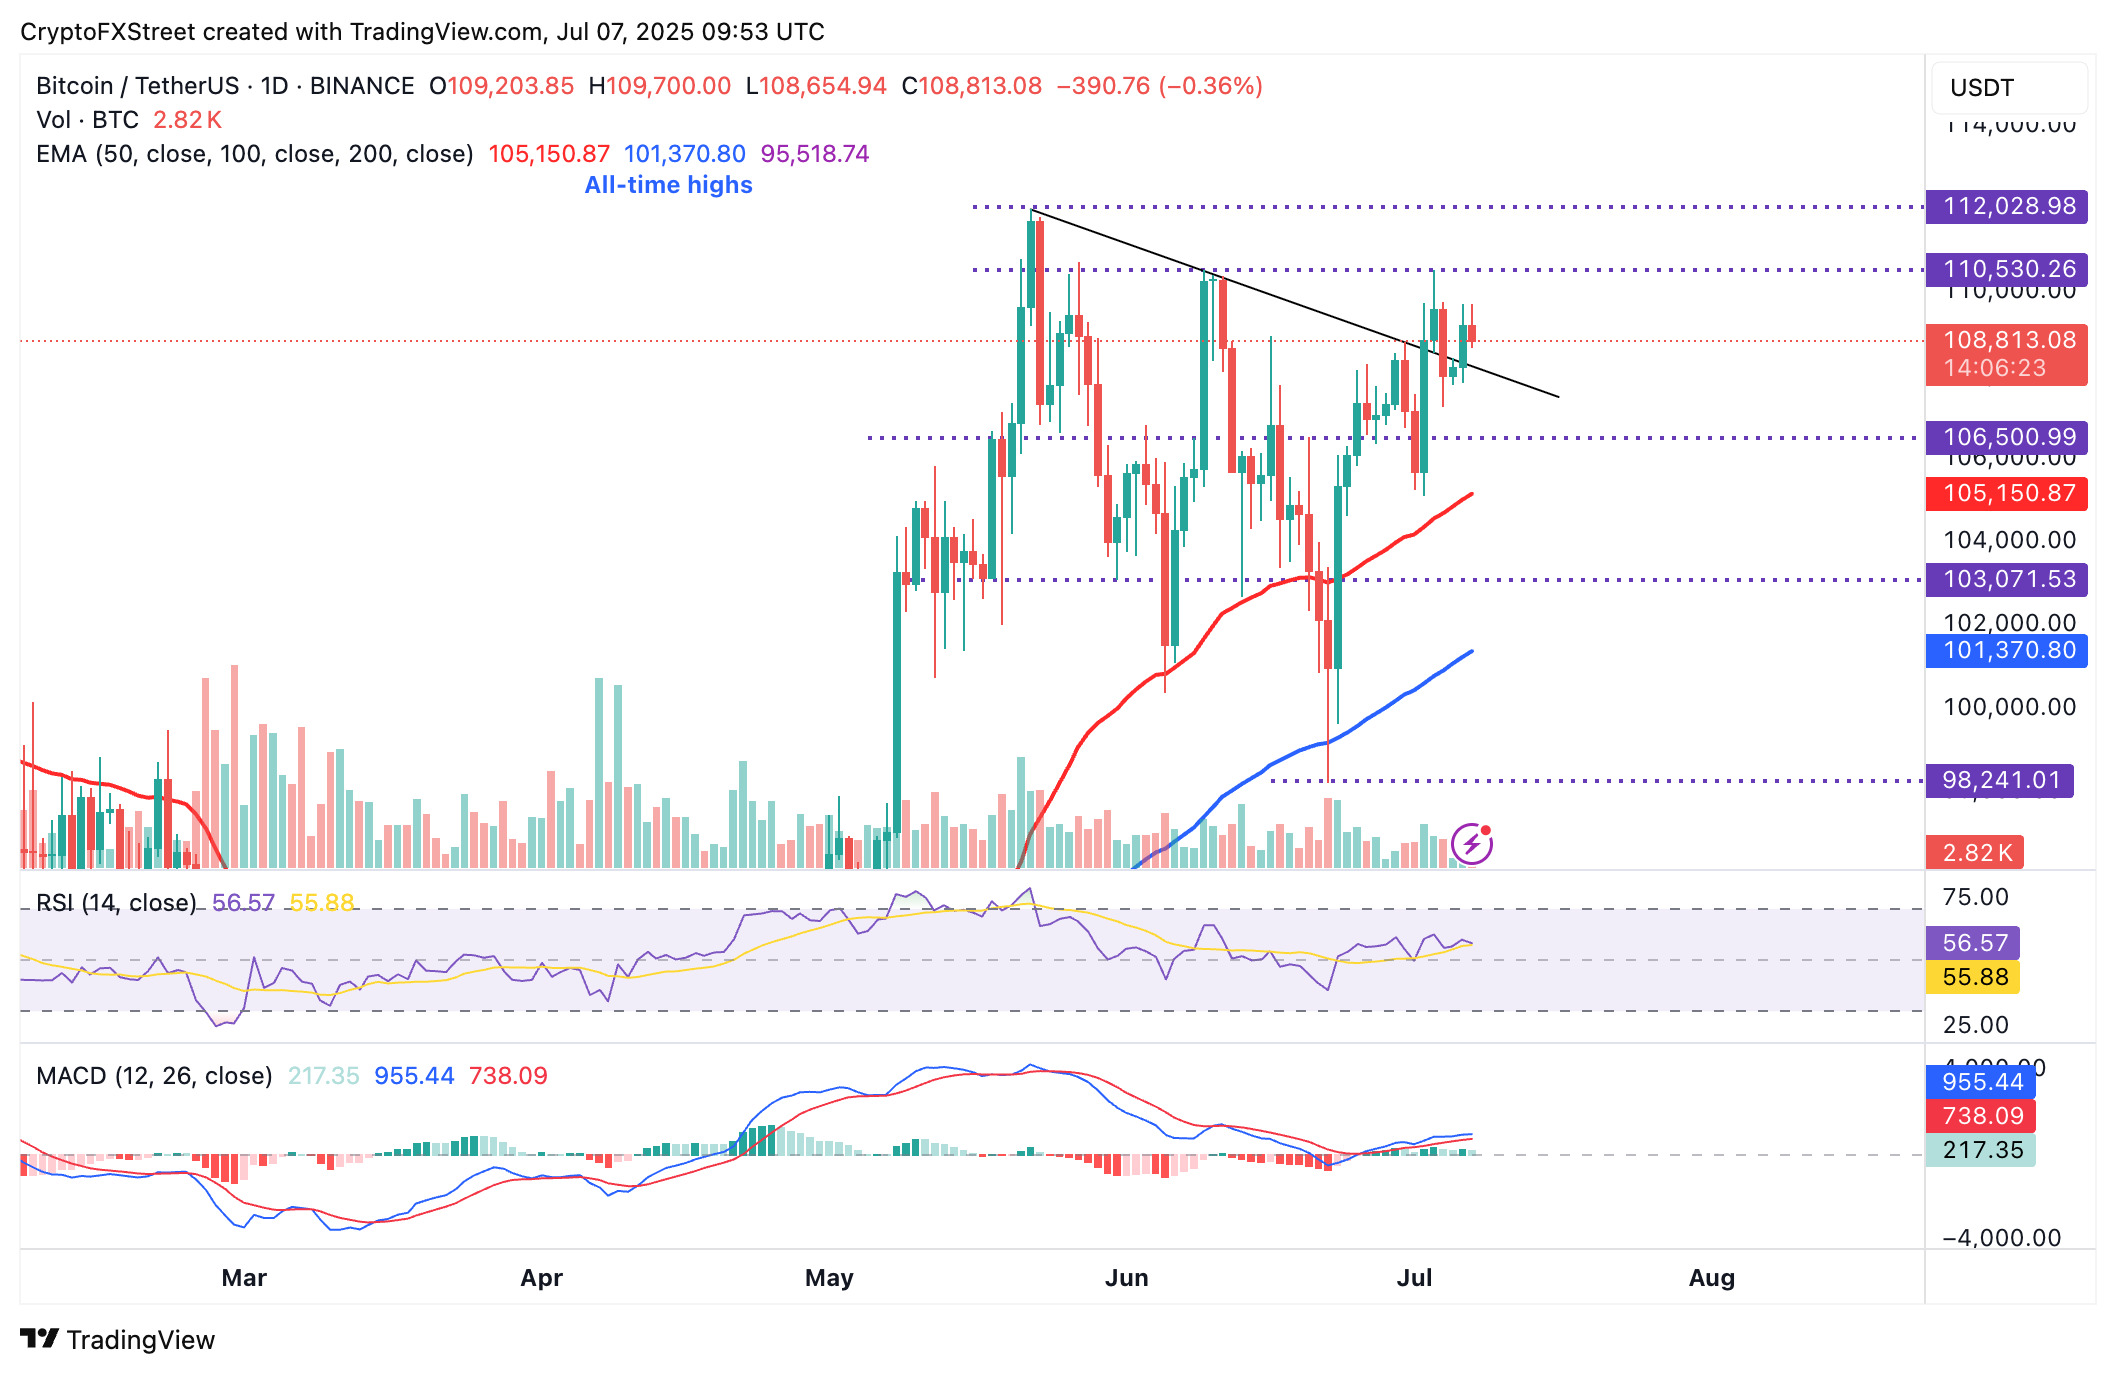
BTC/USDT daily chart
Still, downside risks cannot be ignored, and hence, there's a need to monitor tentative support areas at $106,500, which was tested on June 27, and the 50-day Exponential Moving Average (EMA), currently at $105,150.
Altcoins update: Ethereum, XRP offer mixed signals
Ethereum's price remains relatively unchanged on Monday, trading at around $2,568 at the time of writing. Technical indicators, including the MACD with a buy signal and the RSI, which is holding sideways at 55, indicate consolidation.
Bulls showcase resilience, positioning the ETH price for a potential break above the $2,600 round-number hurdle and the seller congestion at $2,634, last tested on Thursday.
Based on the ETH price position above the 200-day EMA, currently at $2,473, the 50-day EMA at $2,455, and the 100-day EMA at $ 2,399, the technical structure remains solid.
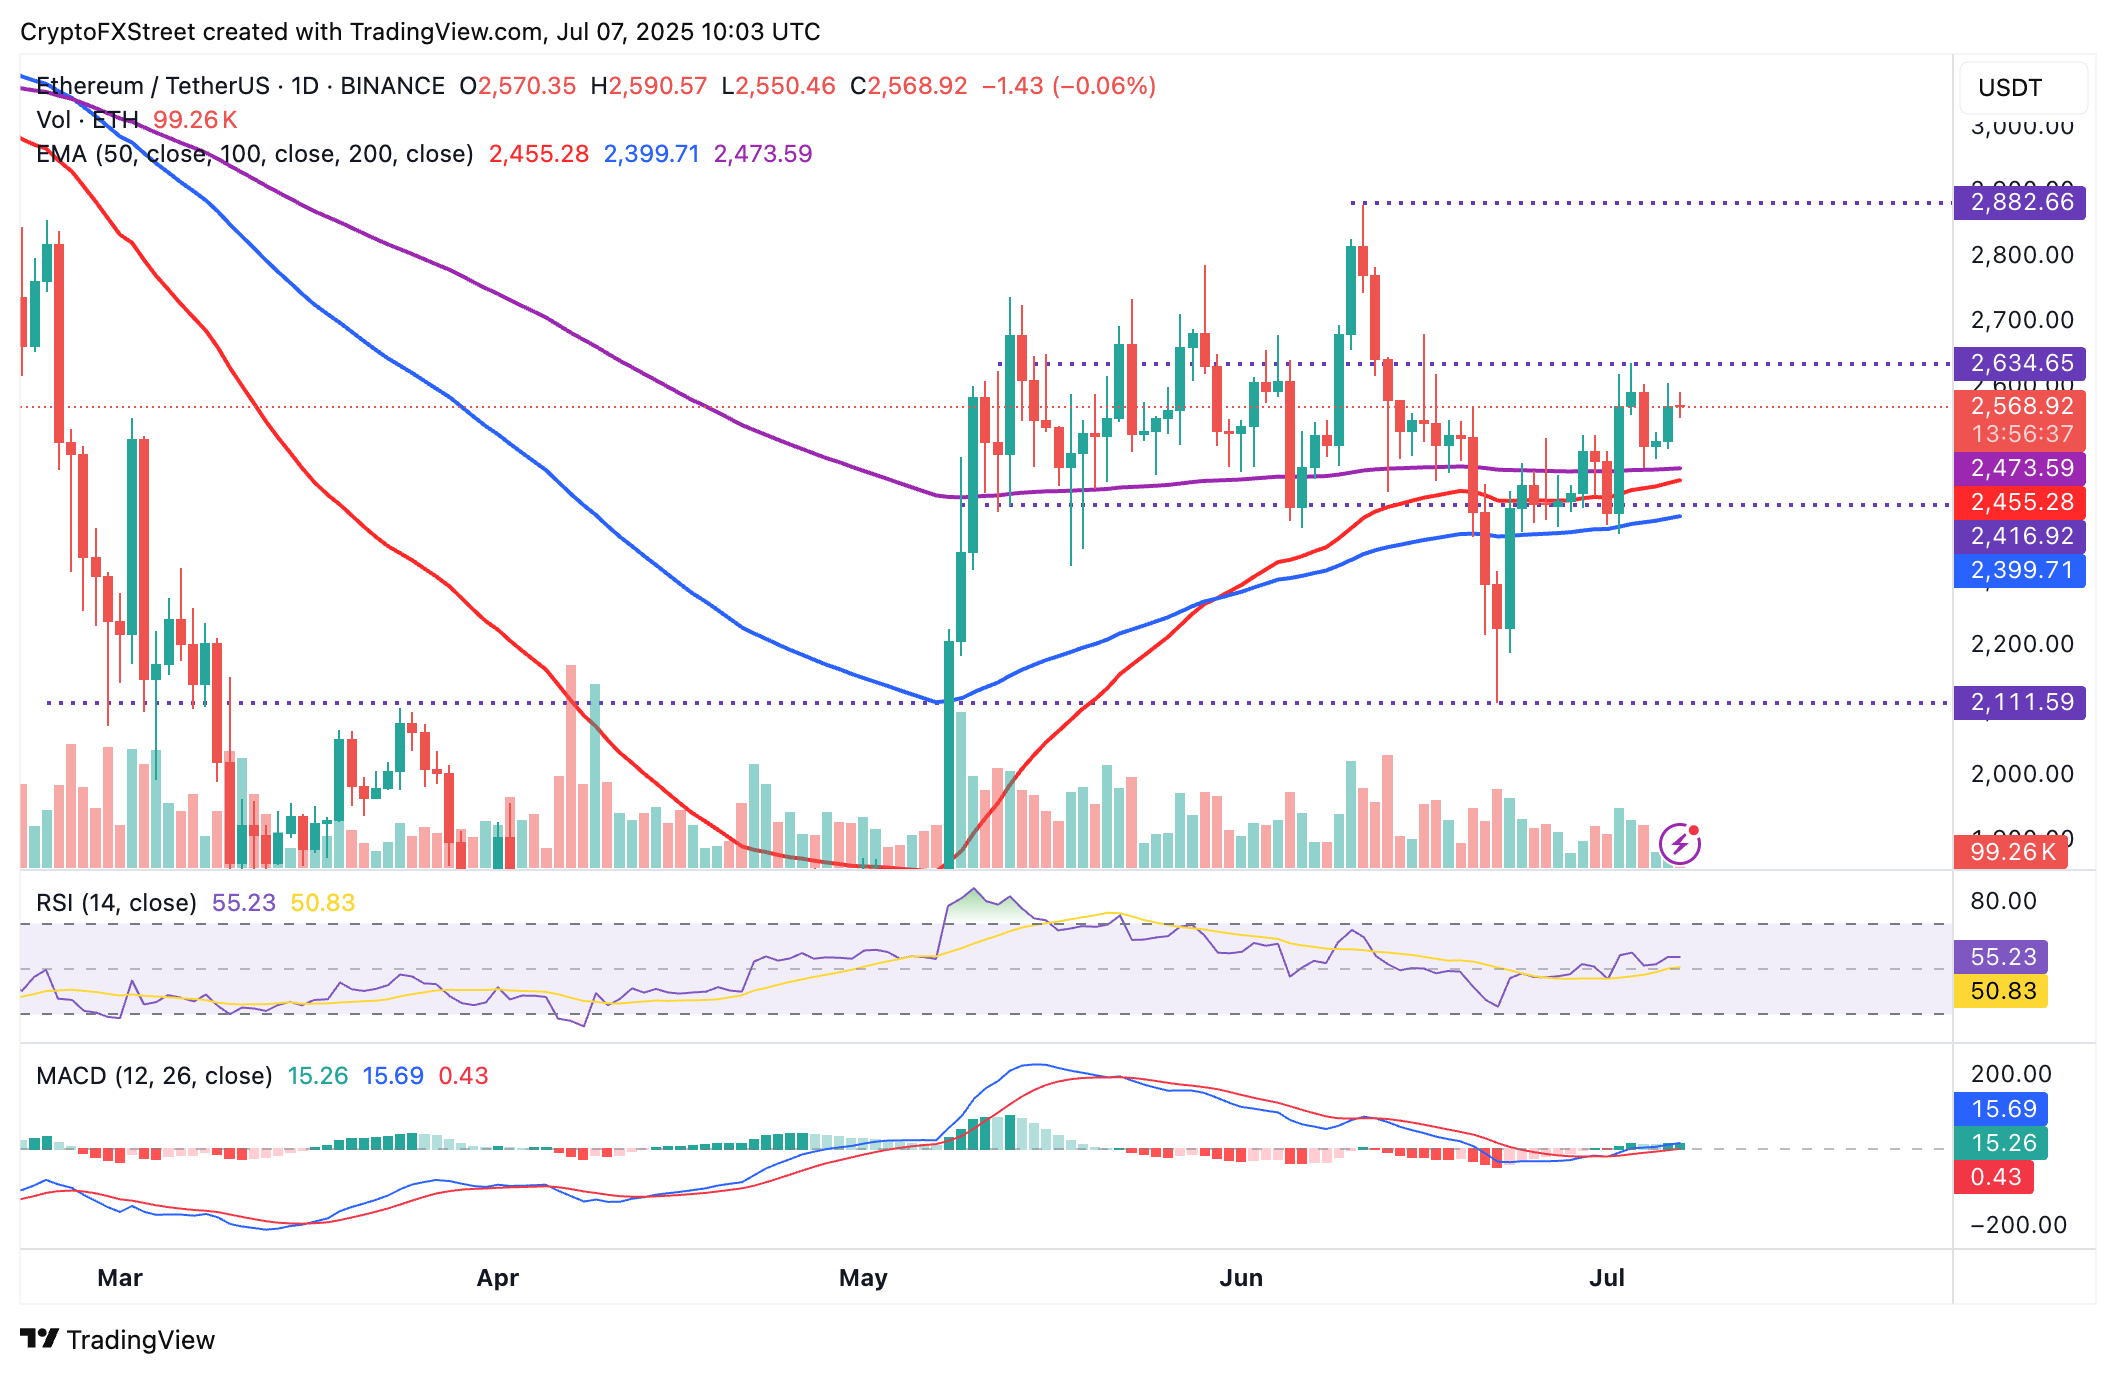
ETH/USDT daily chart
As for XRP, bulls are regaining strength, pushing toward resistance at $2.33. The RSI's upward trajectory at 56 supports the short-term bullish outlook, with the MACD indicator's buy signal encouraging traders to increase their exposure.
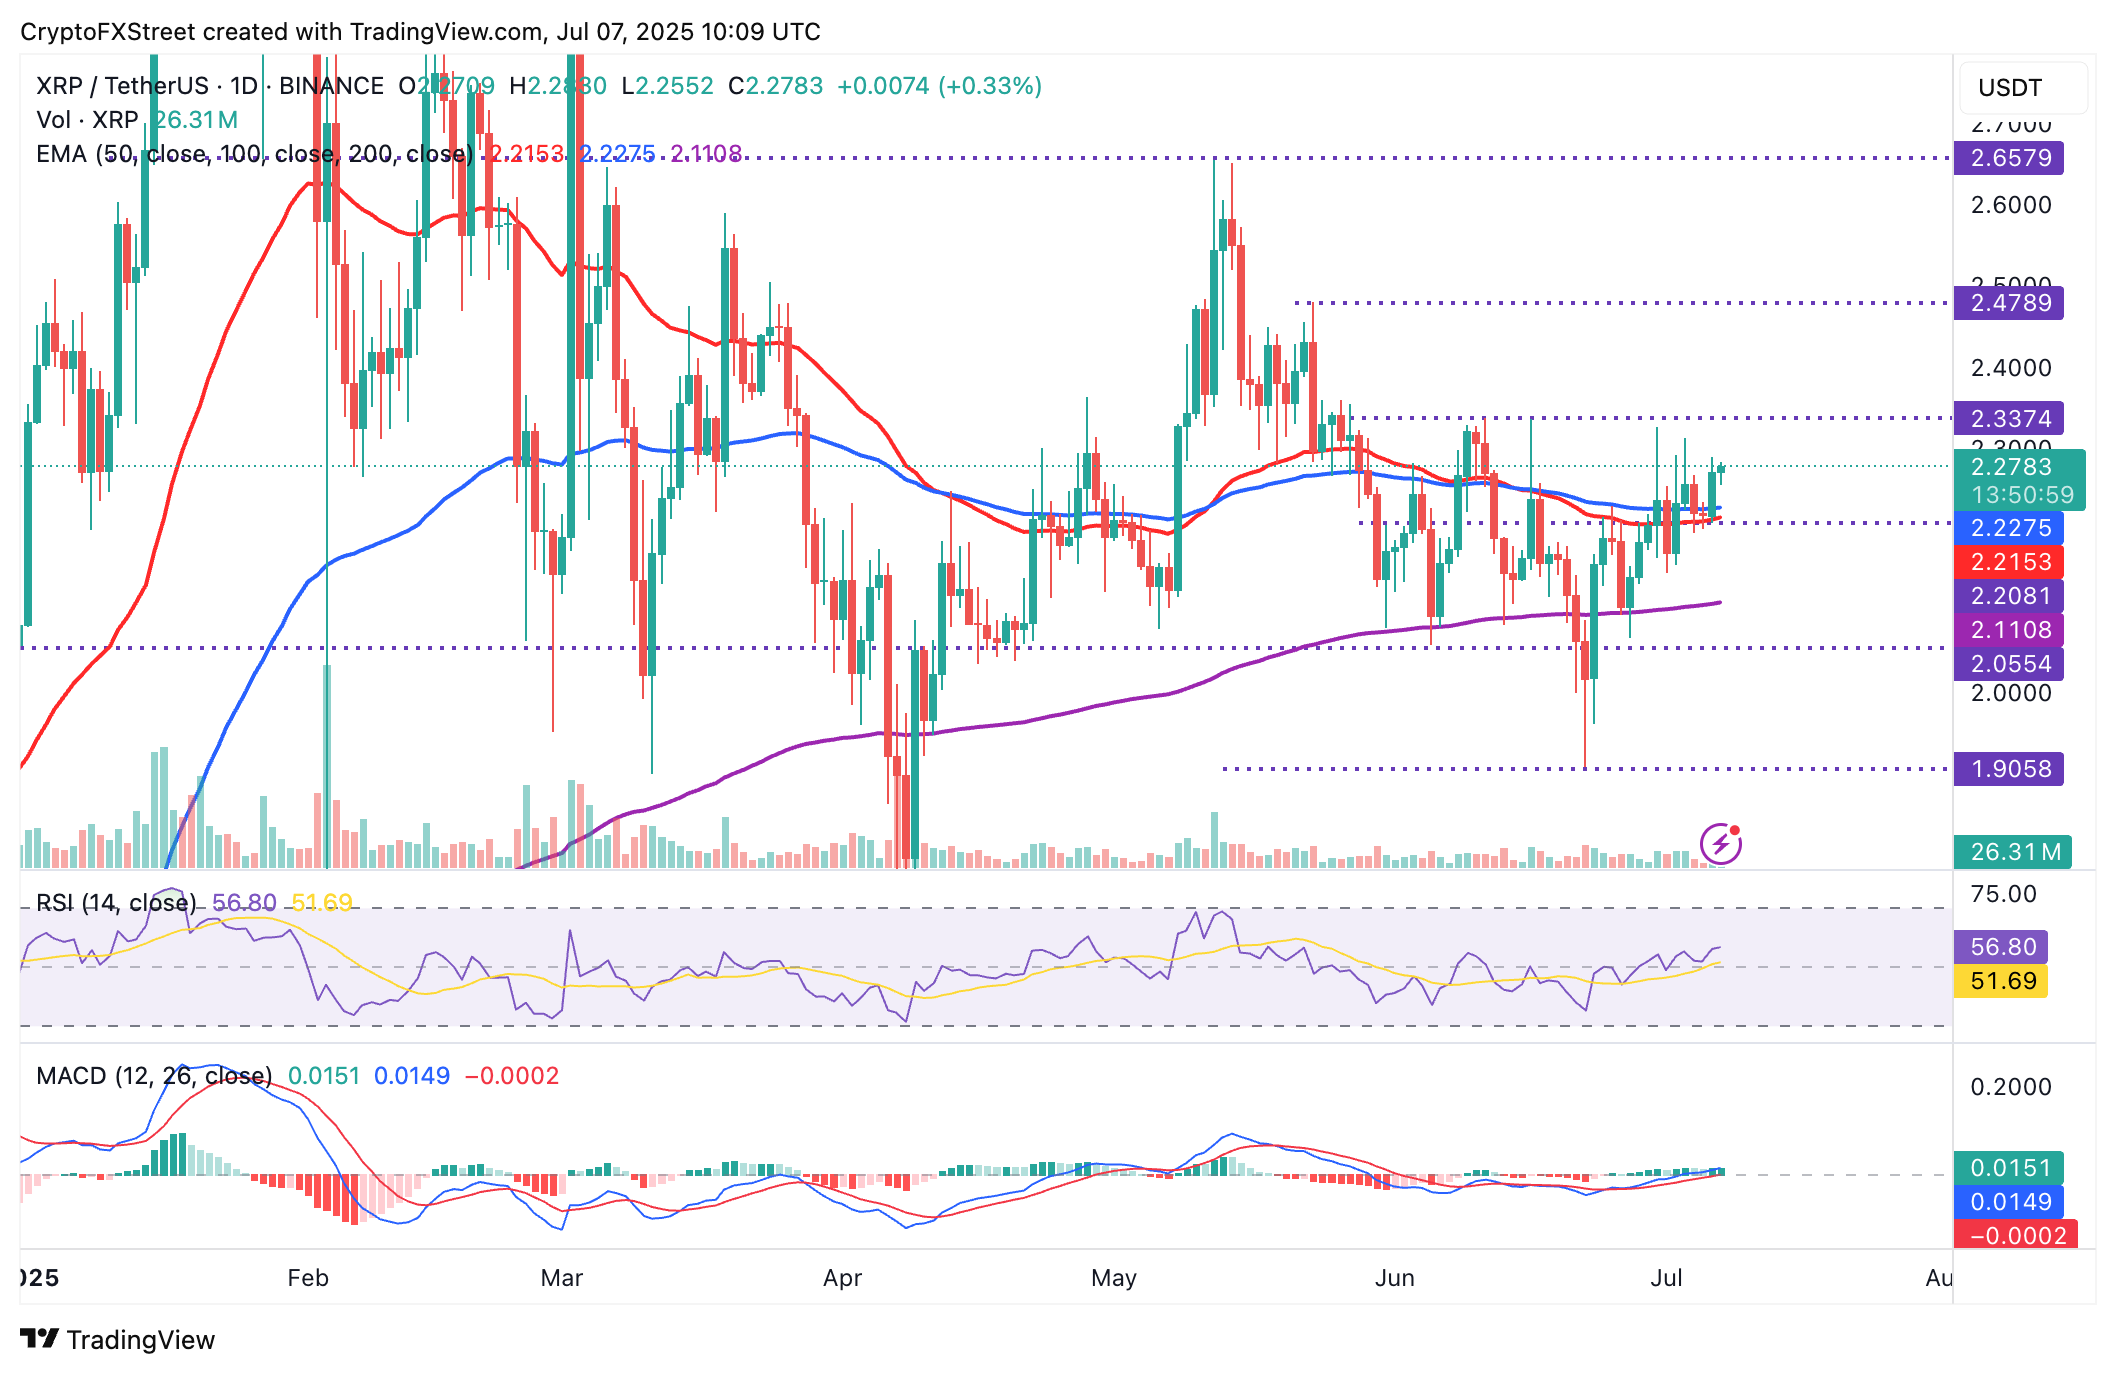
XRP/USDT daily chart
If the path of least resistance remains upward, the price of XRP could edge higher toward the next key hurdle at $2.47, tested on May 23 and May's peak at $2.65. On the downside, XRP is supported above critical levels, provided by the 100-day EMA at $2.22, the 50-day EMA at $2.21, and the 200-day EMA at $2.11.
Cryptocurrency prices FAQs
Token launches influence demand and adoption among market participants. Listings on crypto exchanges deepen the liquidity for an asset and add new participants to an asset’s network. This is typically bullish for a digital asset.
A hack is an event in which an attacker captures a large volume of the asset from a DeFi bridge or hot wallet of an exchange or any other crypto platform via exploits, bugs or other methods. The exploiter then transfers these tokens out of the exchange platforms to ultimately sell or swap the assets for other cryptocurrencies or stablecoins. Such events often involve an en masse panic triggering a sell-off in the affected assets.
Macroeconomic events like the US Federal Reserve’s decision on interest rates influence crypto assets mainly through the direct impact they have on the US Dollar. An increase in interest rate typically negatively influences Bitcoin and altcoin prices, and vice versa. If the US Dollar index declines, risk assets and associated leverage for trading gets cheaper, in turn driving crypto prices higher.
Halvings are typically considered bullish events as they slash the block reward in half for miners, constricting the supply of the asset. At consistent demand if the supply reduces, the asset’s price climbs.
Author

John Isige
FXStreet
John Isige is a seasoned cryptocurrency journalist and markets analyst committed to delivering high-quality, actionable insights tailored to traders, investors, and crypto enthusiasts. He enjoys deep dives into emerging Web3 tren

