Crypto Today: Bitcoin, Ethereum, XRP tick up as Oil prices surge amid US-Iran war
- Bitcoin shows strength, rising above $68,000 as Oil spike extends beyond 100$ for the first time since 2022 and Iran names new supreme leader.
- Ethereum rebounds near $2,000, supported by the MACD and the RSI momentum indicators.
- XRP holds steady around $1.34, weighed down by declining moving averages.

The cryptocurrency market remains relatively stable as the United States (US)-Israel war with Iran rages on. Bitcoin (BTC) is edging up above $68,000 at the time of writing on Monday, as Ethereum (ETH) and Ripple (XRP) test recovery strength above $2,000 and $1.36, respectively.
Middle East war escalates as Oil prices surge
The US and Israel are doubling down their attacks on Iran amid heightened volatility in global financial markets. Regional spill over has seen more Gulf countries come under attack, with Saudi Arabia reporting its first war-related deaths, according to NBC News.
Meanwhile, Iran's Assembly of Experts has selected Mojtaba Khamenei as the third leader of the Islamic Republic. He is the second son of Ali Khamenei, who was the late Supreme Leader, killed after an American-Israeli attack.
Global markets and governments remain on edge as Crude Oil prices surge past $100 for the first time since 2022. The closure of the Straits of Hormuz continues to disrupt shipping, with the war's effects likely to be felt worldwide.
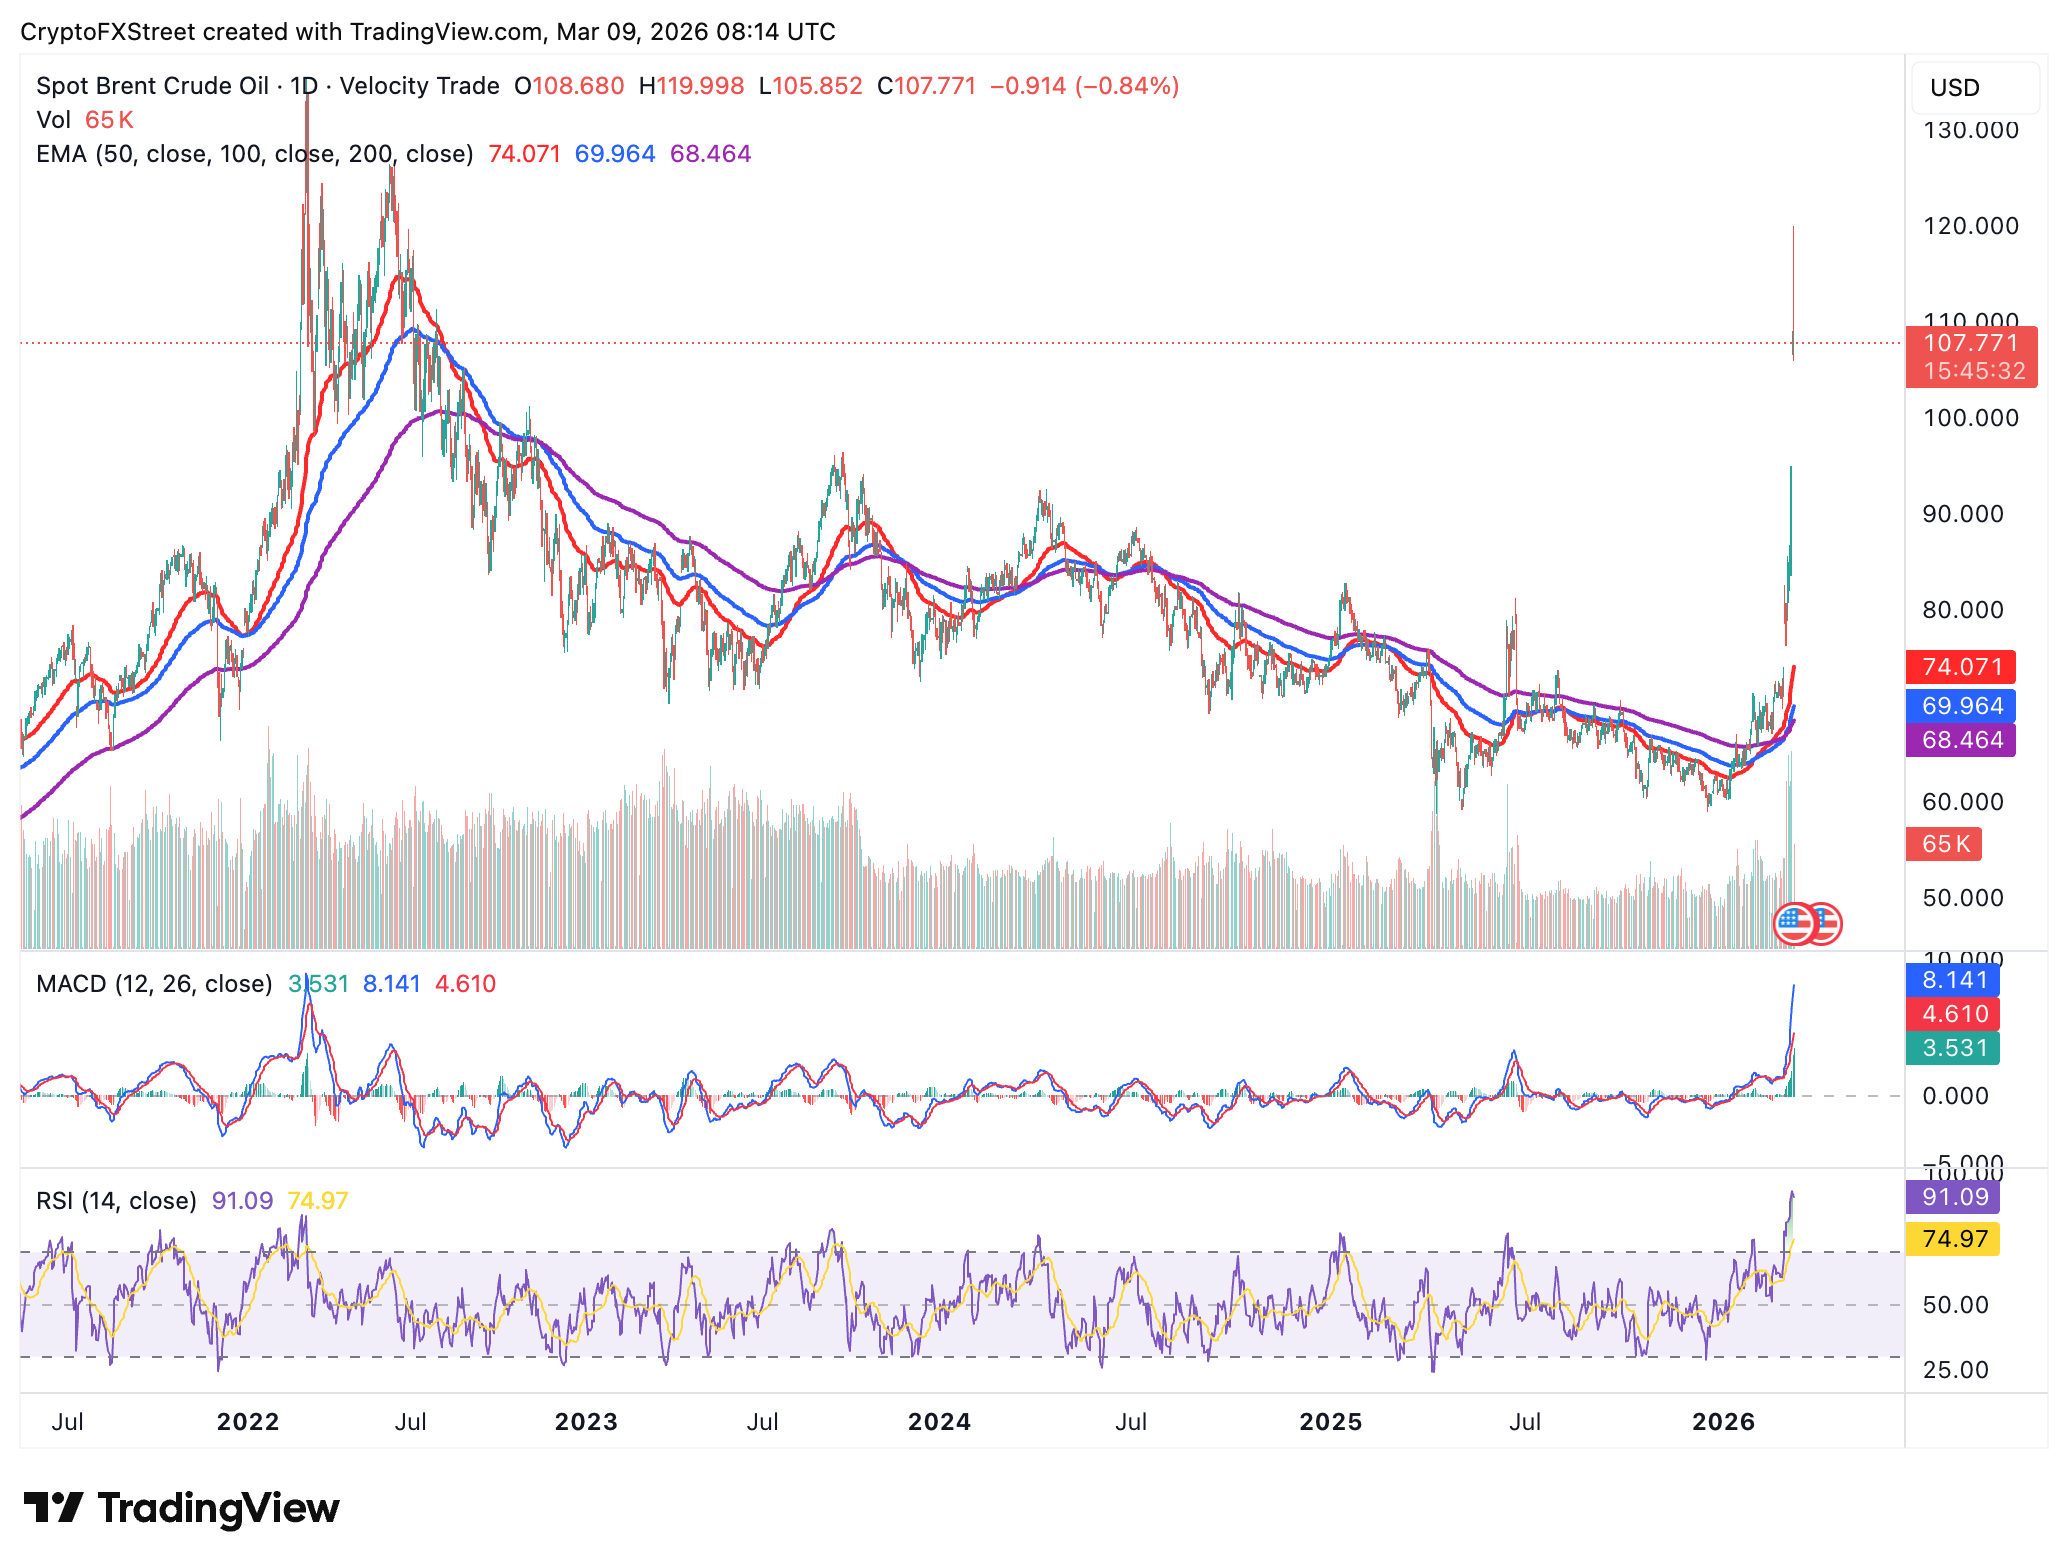
Chart of the day: Bitcoin rises as bulls tighten their grip
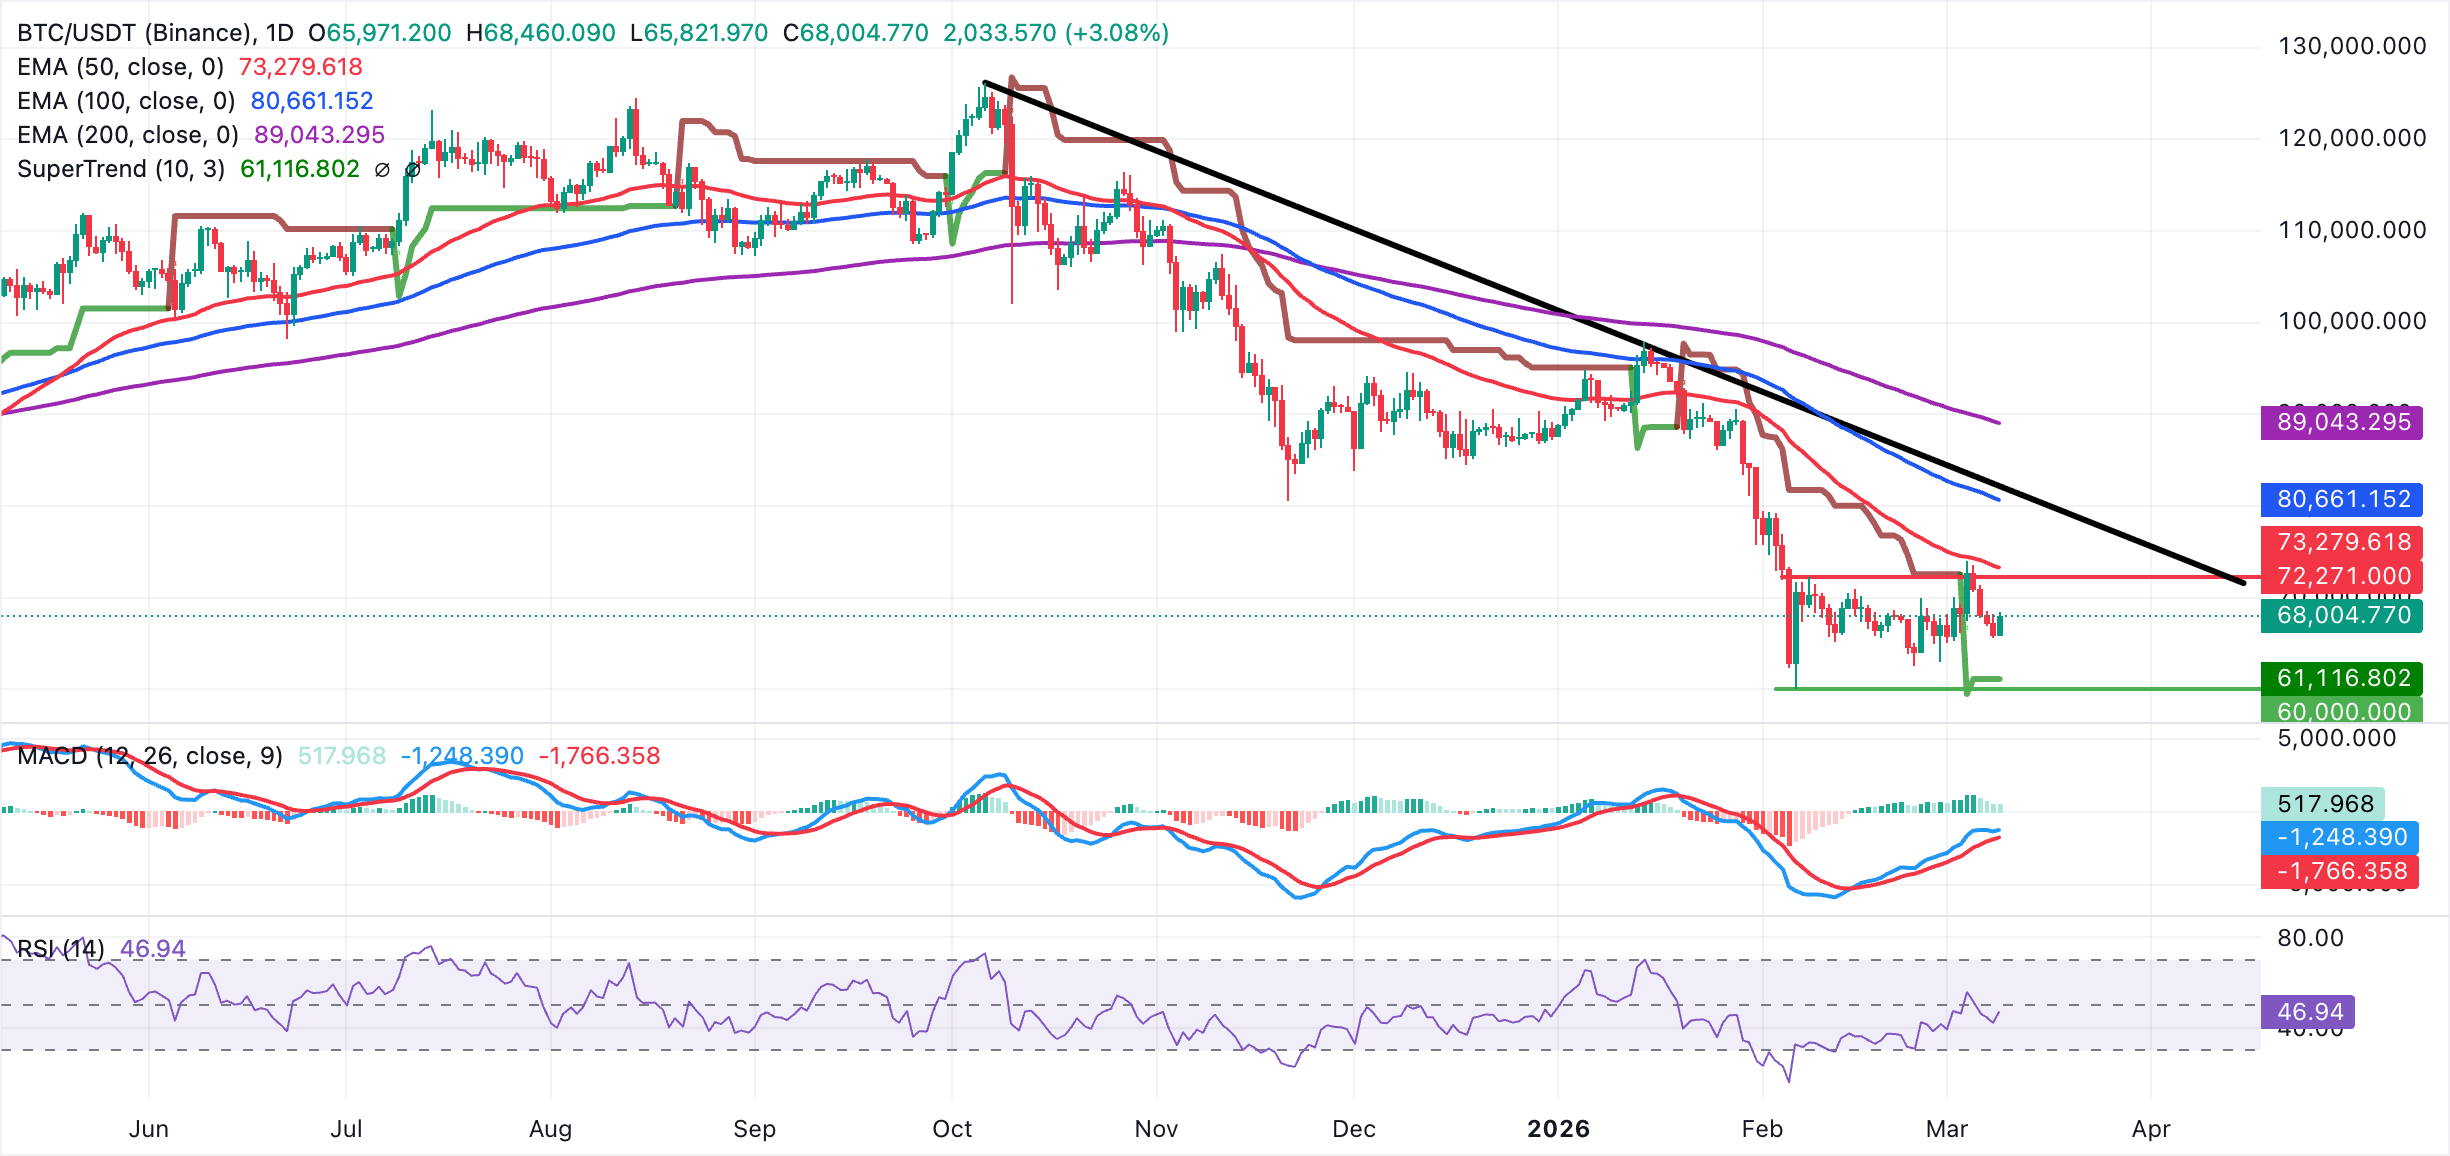
Bitcoin hovers above $68,000, with bulls pushing to weaken the upper end of the range resistance at $72,271, aligning with the February 8 high. The SuperTrend indicator has flipped below the spot price, reinforcing a bullish bias. At the same time, momentum appears steady, supported by the Moving Average Convergence Divergence (MACD), which remains above its signal line on the daily chart. Contracting green histogram bars signal caution amid tempered expectations.
The Relative Strength Index (RSI) is recovering toward the neutral line on the same chart, suggesting that bearish momentum is easing ahead of a potential bullish shift.
Immediate support emerges at $65,971, the daily open. A break below this area would open the downside toward the SuperTrend indicator at $61,116. On the topside, initial resistance lies at the $70,000 pivotal threshold, followed by the upper end of the range around $72,271. Any sustained break above this region is needed to challenge the 50-day Exponential Moving Average (EMA) at $73,280.
Altcoins technical outlook: Ethereum and XRP hold gains
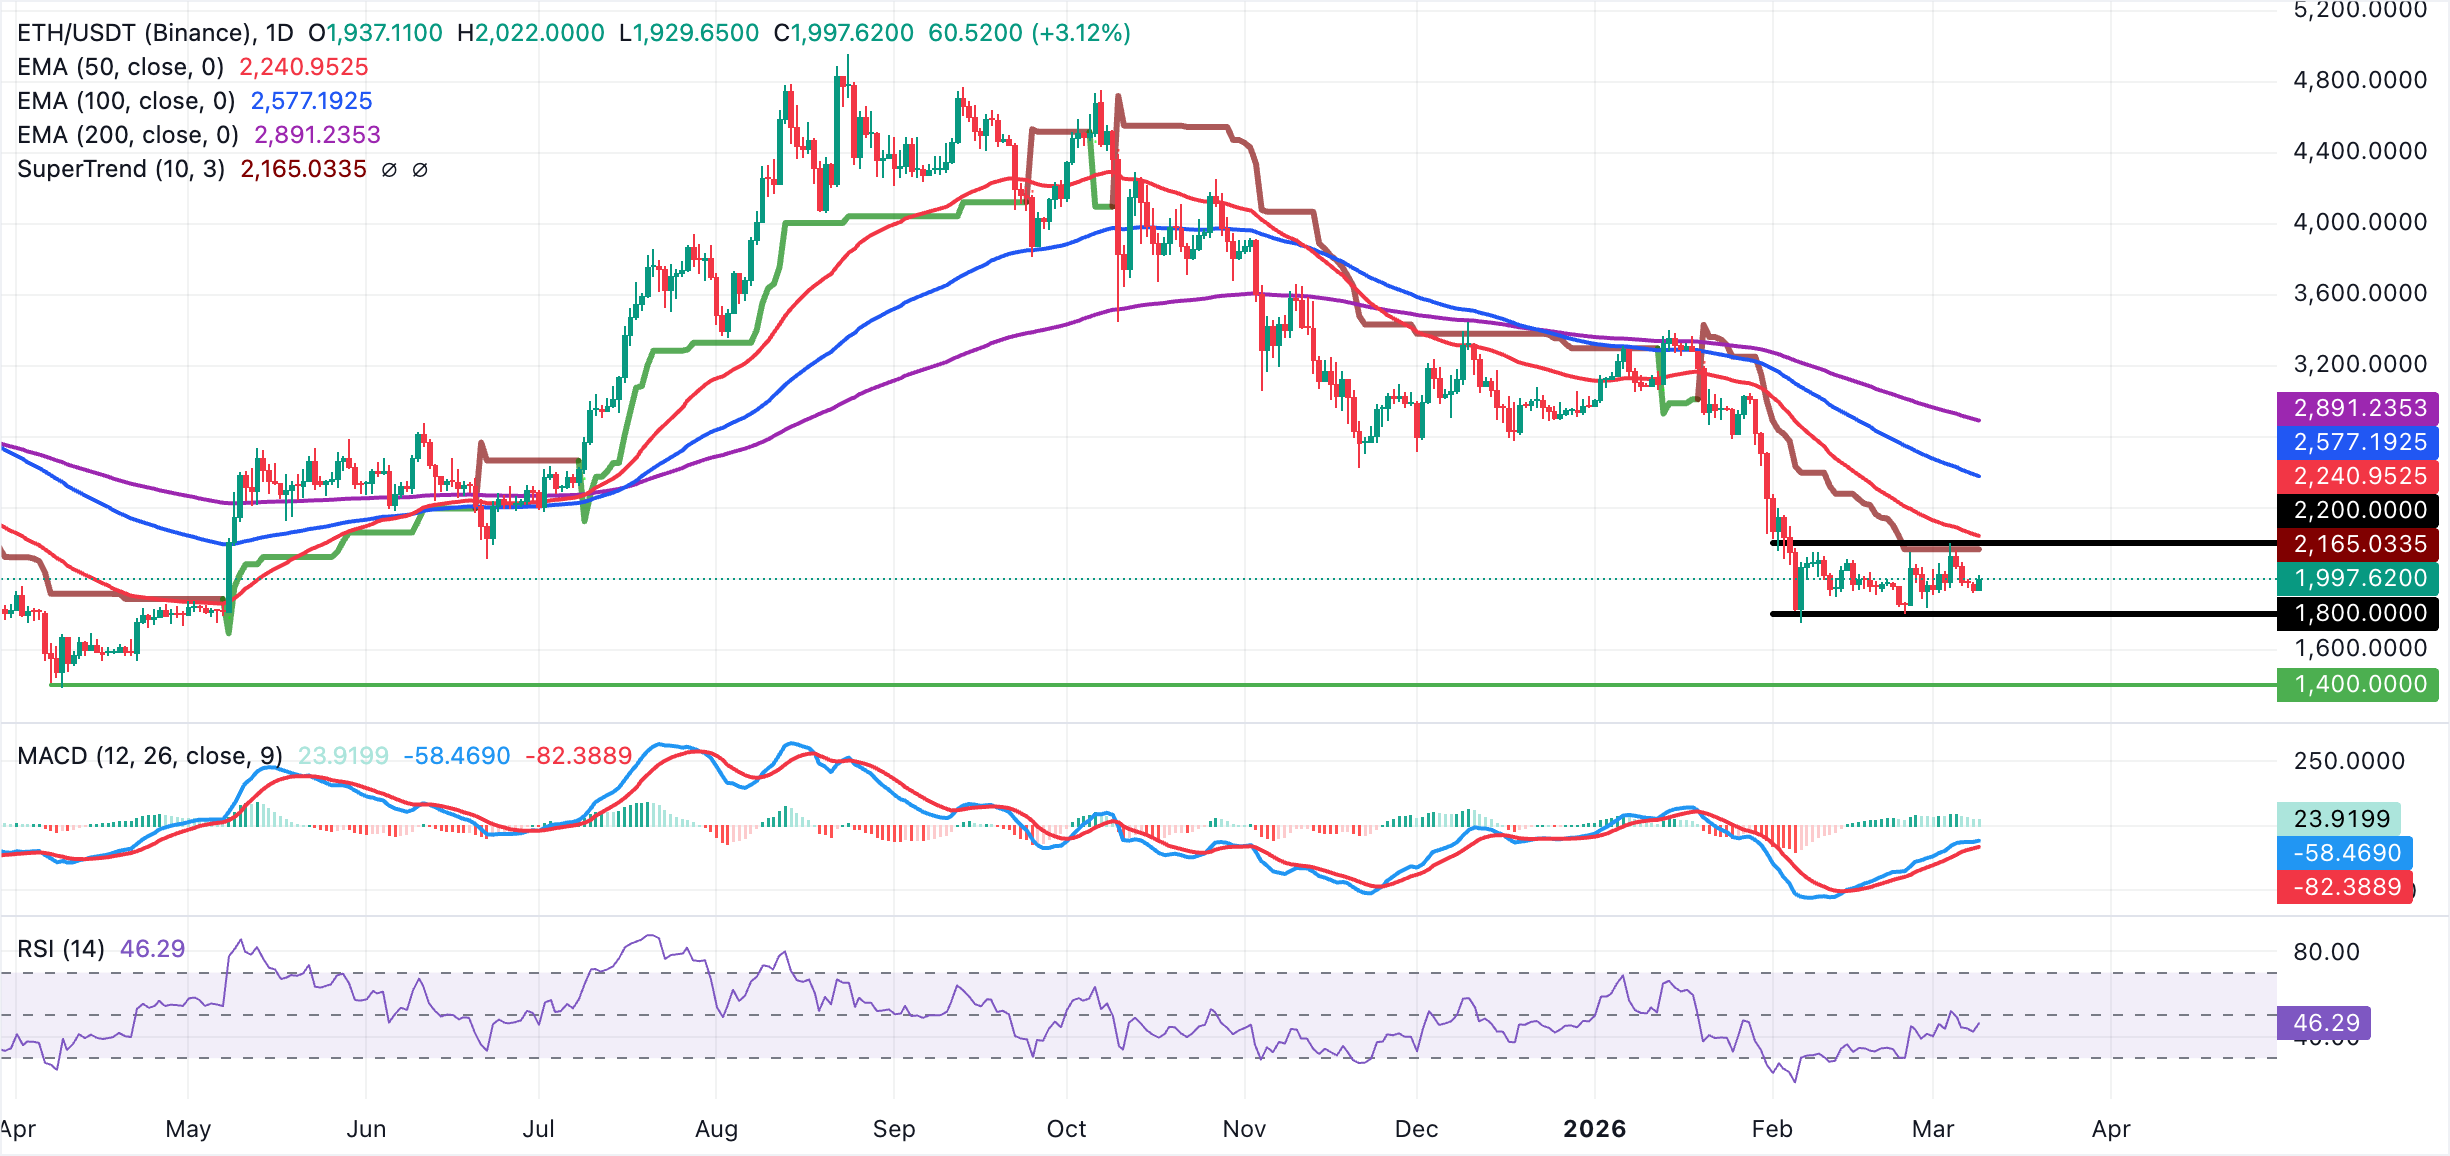
Ethereum is trading broadly sideways around $2,000, with a cautiously bullish near-term bias. The MACD line holds above its signal line on the daily chart, though it has been slipping, suggesting fading but still positive upside momentum. At the same time, the RSI near 46 lifts off toward the neutral line on the same chart, indicating bears are gradually losing control even if buyers lack clear dominance. Moreover, the price remains well below the 50-day, 100-day and 200-day EMAs, which keeps the broader trend down.
Initial resistance emerges at the SuperTrend indicator, which lies at $2,165. A daily close above that area would open the path toward the 50-day EMA around $2,241. On the downside, immediate support lies in the $1,930-$1,950 region, which contained the latest pullback, and protects the range low demand zone at $1,800.
As for XRP, bulls are slightly in control, as the price hovers around $1.35 at the time of writing on Monday. Despite the increase from the daily low at $1.33, the near-term bias remains mildly bearish, as upside is capped by the 50-day EMA at $ 1.53, the SuperTrend indicator at $1.57, and the 100-day EMA at $1.75.
Although the MACD indicator holds above the signal line on the daily chart, green histogram bars continue to contract, suggesting limited bullish conviction and keeping rallies vulnerable.
-1773054360965-1773054360968.png)
A daily close above $1.40 would be needed to ease immediate pressure, while reclaiming the 50-day EMA would be required to challenge the broader downside. On the downside, initial support emerges at the daily low near $1.33, with a break opening the way toward the February 28 trough at $1.27.
Open Interest, funding rate FAQs
Higher Open Interest is associated with higher liquidity and new capital inflow to the market. This is considered the equivalent of increase in efficiency and the ongoing trend continues. When Open Interest decreases, it is considered a sign of liquidation in the market, investors are leaving and the overall demand for an asset is on a decline, fueling a bearish sentiment among investors.
Funding fees bridge the difference between spot prices and prices of futures contracts of an asset by increasing liquidation risks faced by traders. A consistently high and positive funding rate implies there is a bullish sentiment among market participants and there is an expectation of a price hike. A consistently negative funding rate for an asset implies a bearish sentiment, indicating that traders expect the cryptocurrency’s price to fall and a bearish trend reversal is likely to occur.
(The technical analysis of this story was written with the help of an AI tool.)
Author

John Isige
FXStreet
John Isige is a seasoned cryptocurrency journalist and markets analyst committed to delivering high-quality, actionable insights tailored to traders, investors, and crypto enthusiasts. He enjoys deep dives into emerging Web3 tren


