Crypto Today: Bitcoin, Ethereum, XRP extend gains after Trump says Iran war could end soon
- Bitcoin reclaims the pivotal $70,000 threshold as Trump says that the Iran war could be over soon.
- Ethereum rises for the second consecutive day, holding above $2,000 despite ETF outflows.
- XRP tests the immediate $1.45 resistance even as institutional interest fades.

The cryptocurrency market is regaining strength at the time of writing on Tuesday, after United States (US) President Donald Trump said the Iran war could be over soon.
Bitcoin (BTC) is trading well above $70,000 as investors price in US President Trump’s latest remarks on the war. Ethereum (ETH) is edging higher above $2,000 while Ripple (XRP) tests the supply zone around $1.45.
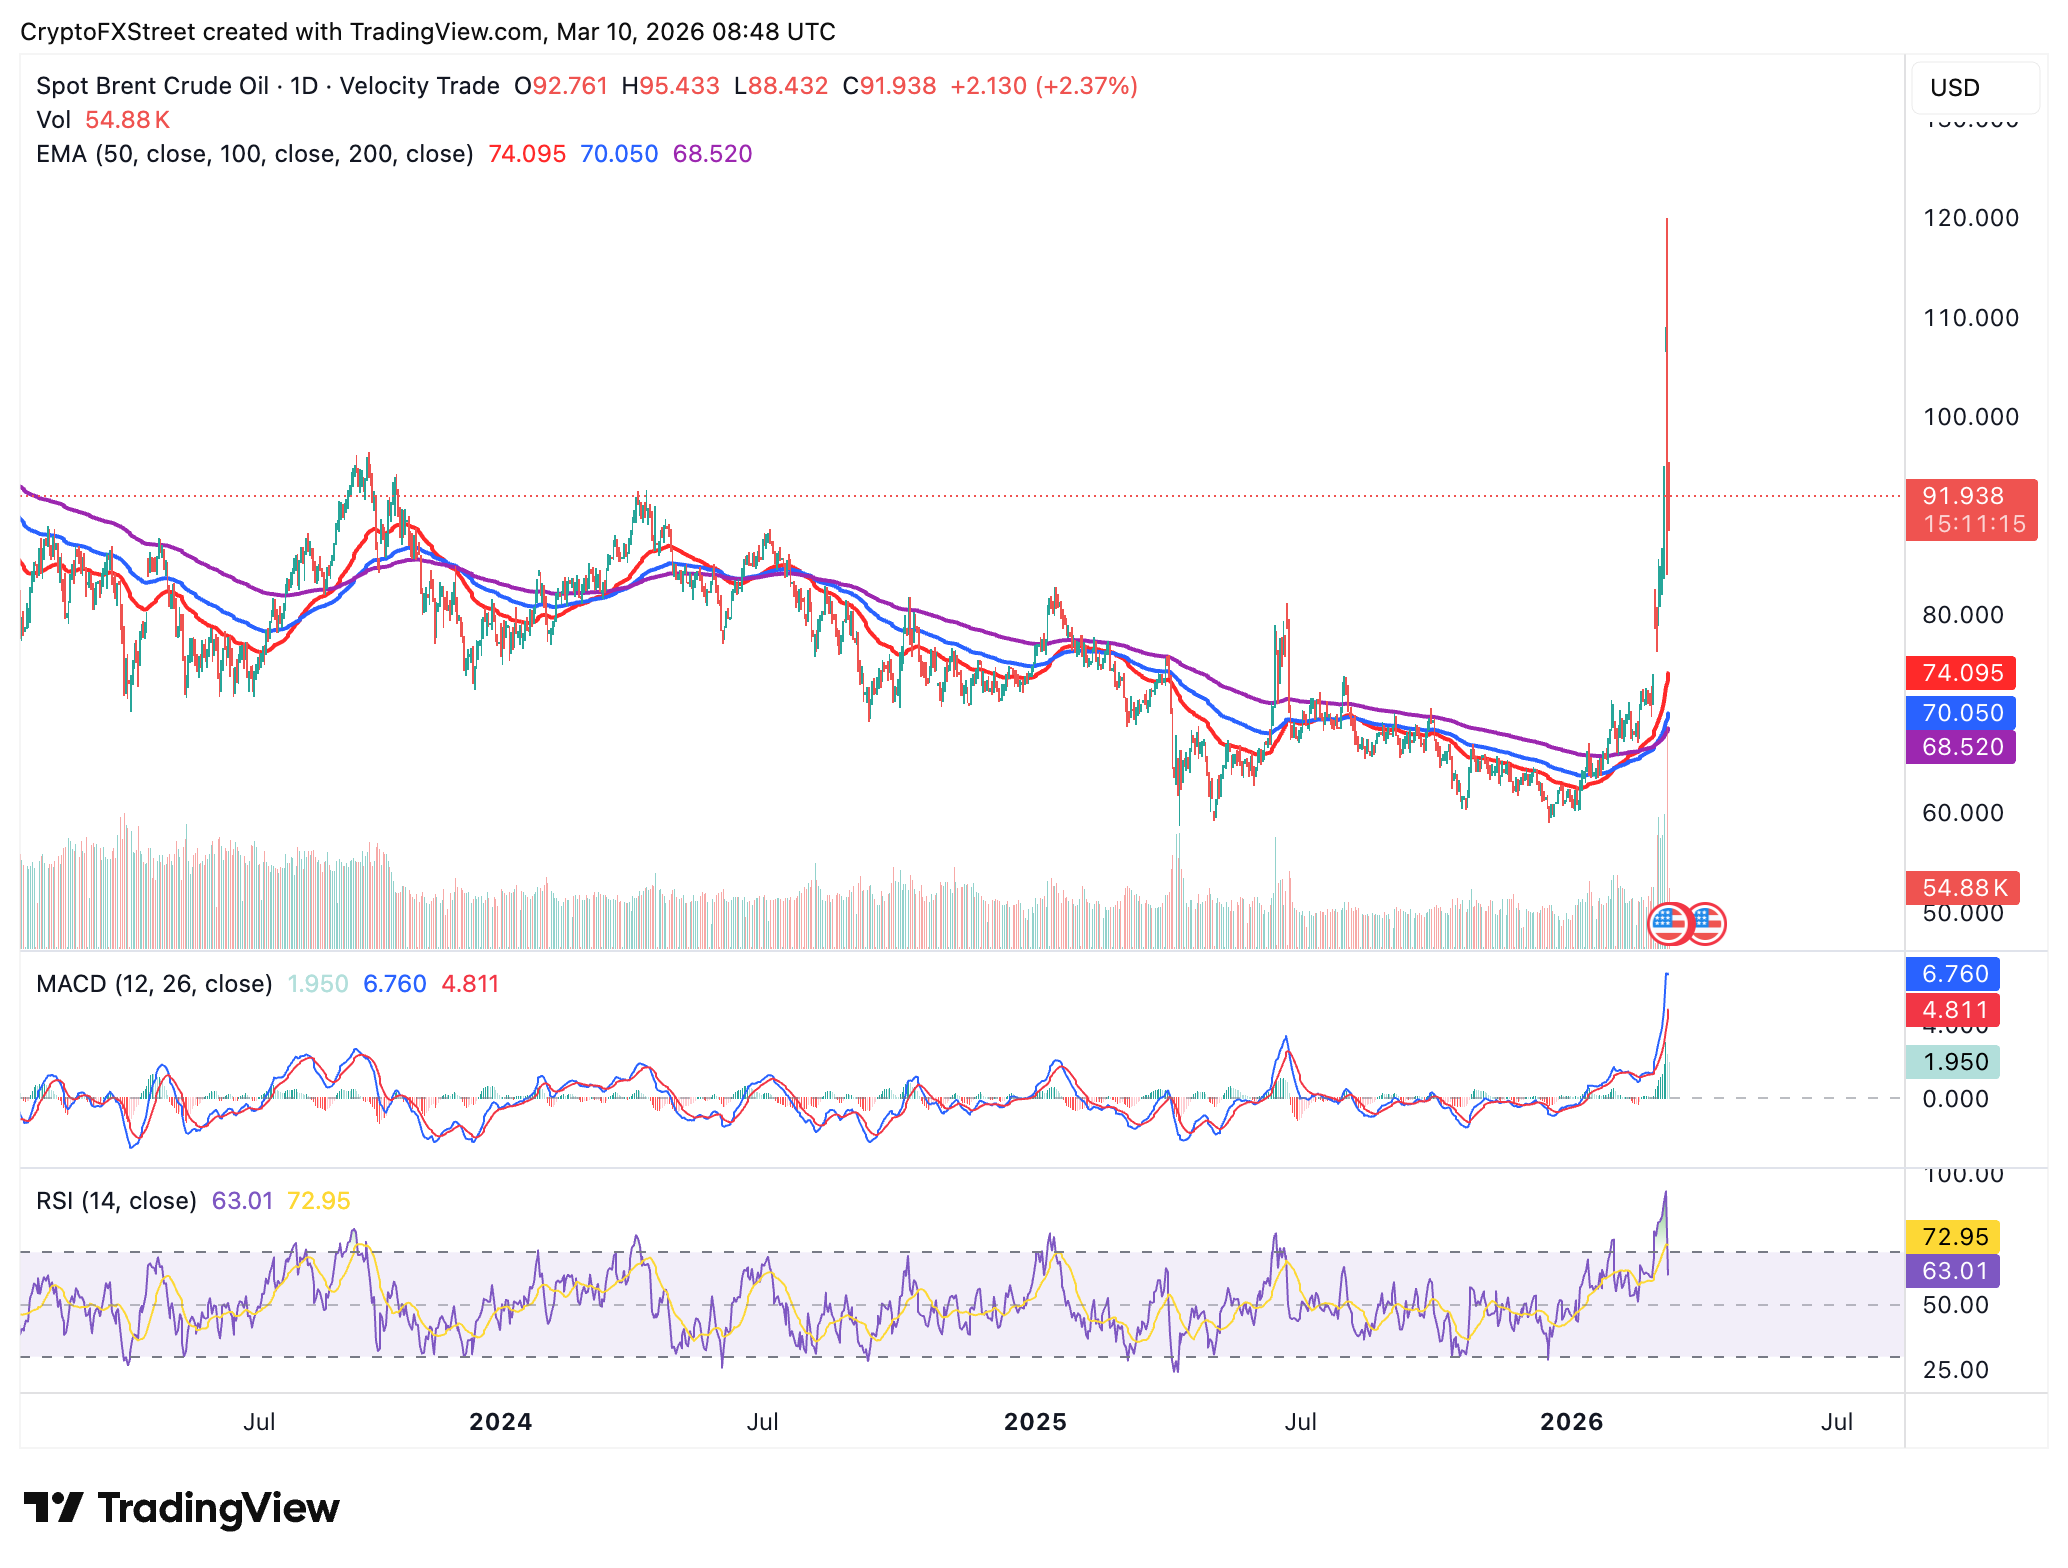
Oil prices tumble as Trump says Iran war could end "very soon"
Trump said on Monday that the Iran war, which roped in Gulf countries as the Islamic Republic retaliated, could end "very soon". Despite being optimistic that the US has “already won in many ways,” the president added that he is not declaring the mission accomplished.
Despite the US and Israel’s continued strikes on Iran, the Islamic Republic said that it would keep fighting, according to the Guardian. Iran’s Revolutionary Guard continued to block the passage of ships through the Strait of Hormuz, further escalating the Crude crisis.
Meanwhile, Oil prices crashed from a Monday high of $114 per barrel to $83 and have stabilized at around $89 at the time of writing.
Risk assets, including crypto, could extend gains if sentiment continues to improve and Oil prices stabilize at lower levels, reducing the risk of higher inflation.
Bitcoin ETF inflows return as Ethereum, XRP see outflows
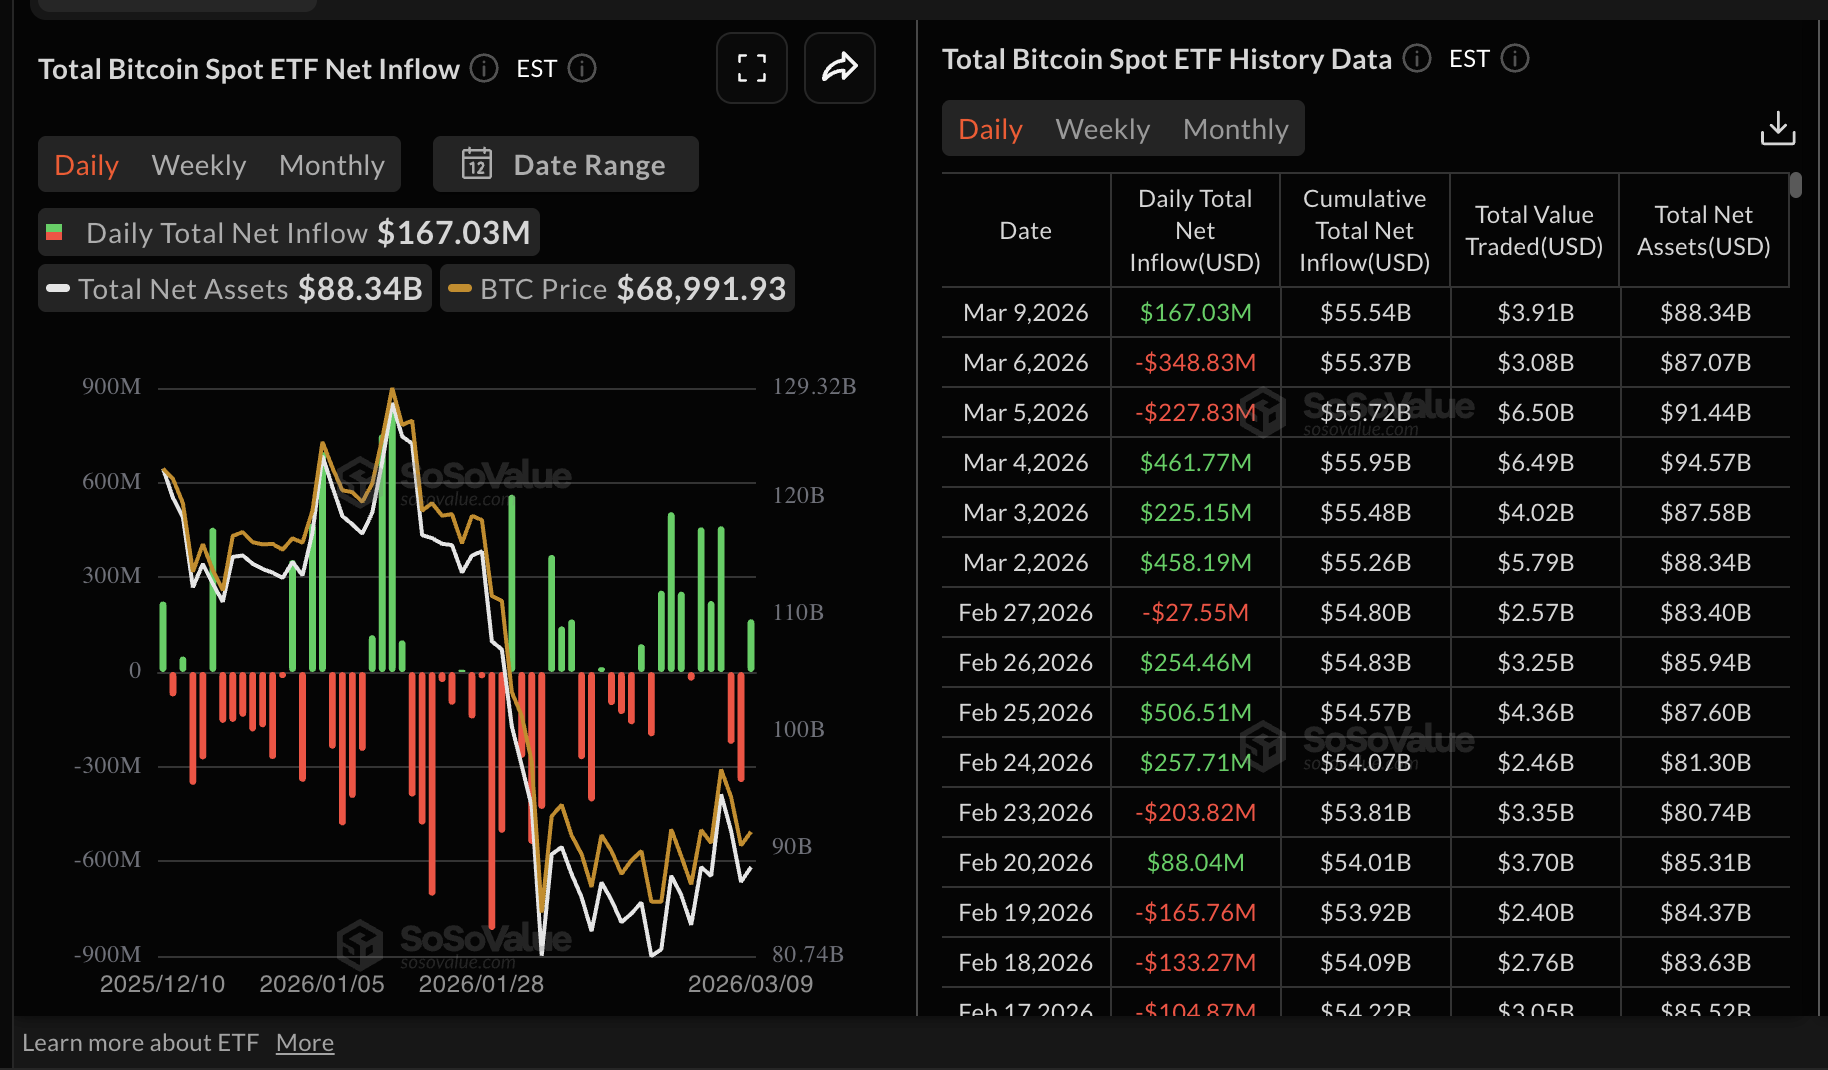
Bitcoin Exchange-Traded Funds (ETFs) kicked off the week on a positive note, recording inflows of $167 million on Monday. This resurgence of institutional interest breaks a two-day streak of outflows, according to SoSoValue. Cumulative inflows stand at $55.54 billion, with net assets at $88.34 billion.
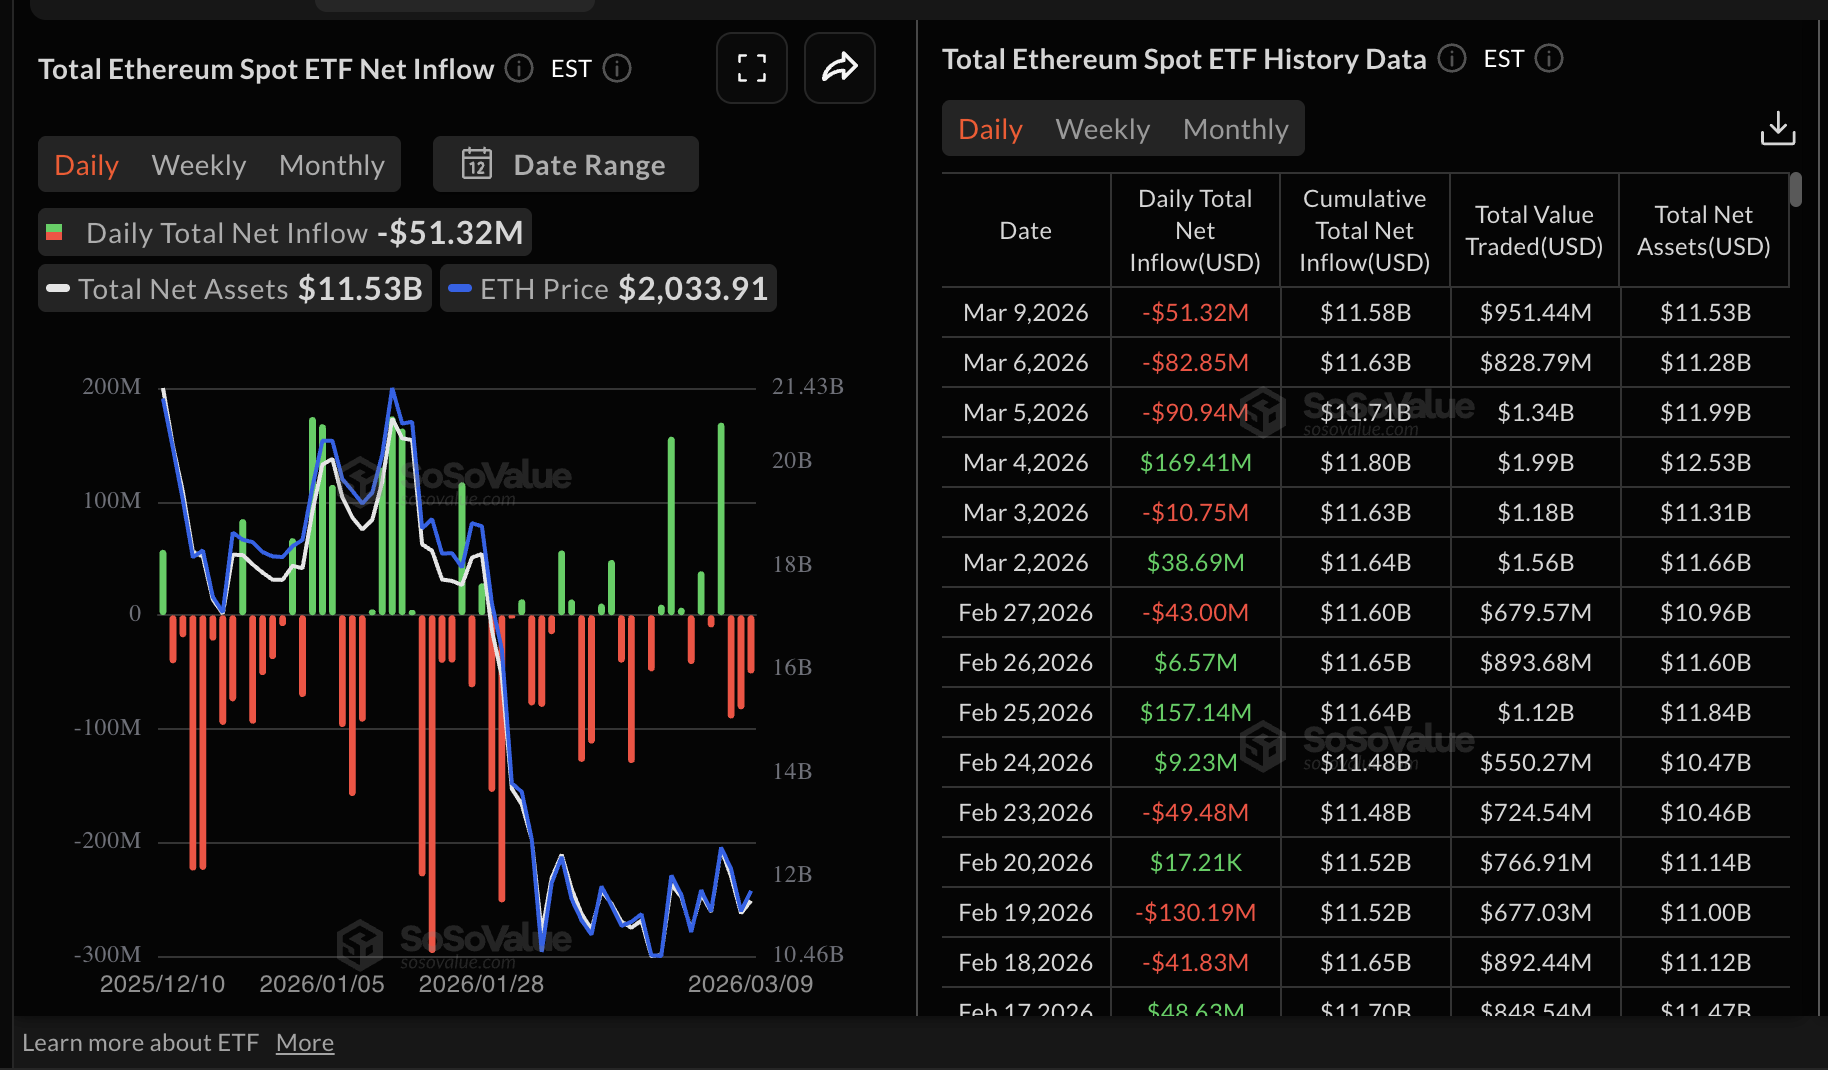
Ethereum spot ETFs, on the other hand, extended their outflow streak for a third consecutive day, with investors withdrawing roughly $51 million on Monday. Interest in Ethereum ETFs has remained volatile amid shrinking cumulative inflows, now totaling $11.58 billion. Net assets under management stand at $11.53 billion.
XRP ETFs also took a back seat, with outflows increasing to $18 million on Monday, from nearly $17 million on Friday. Cumulative inflows stand at $1.22 billion, with net assets at $971.36 million.
Price volatility, macroeconomic uncertainty and geopolitical tensions are among the factors driving the risk-off sentiment around XRP.
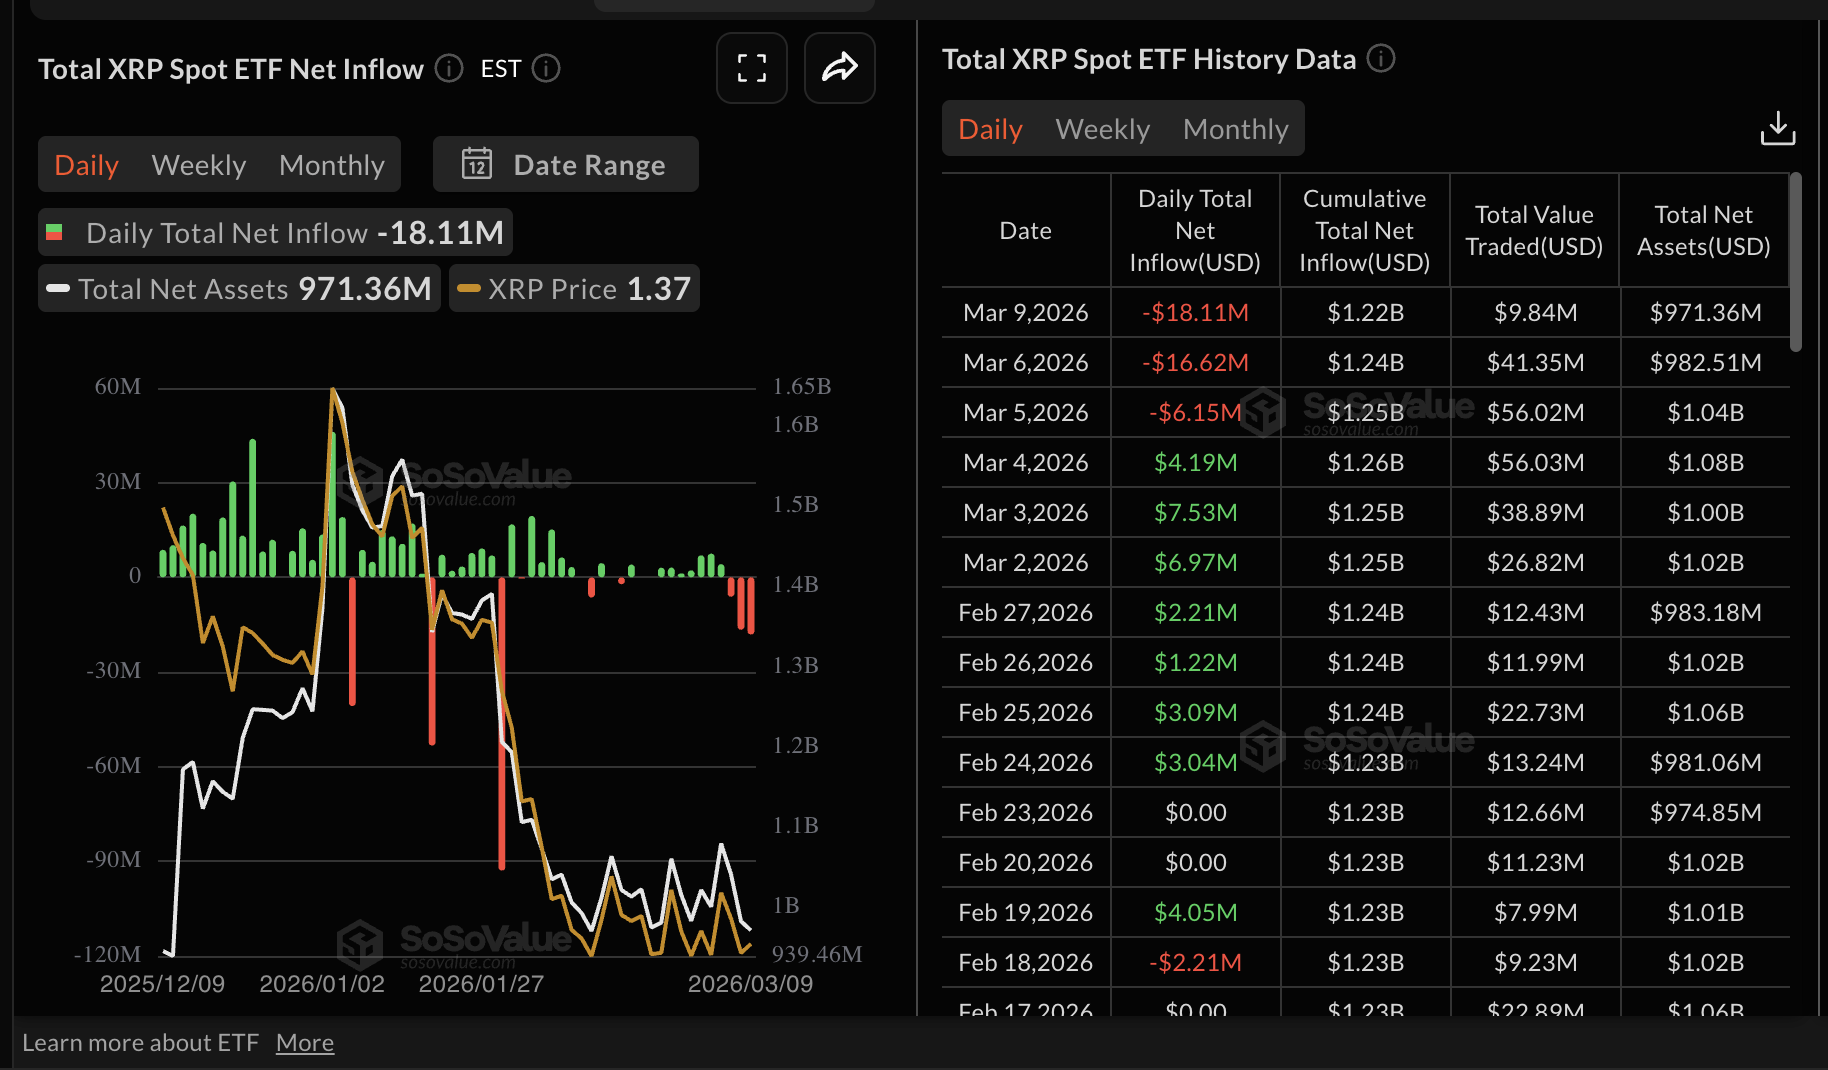
Chart of the day: Bitcoin gains above $70,000
Bitcoin is trading near $71,000, as the near-term bias tilts mildly bullish. The Moving Average Convergence Divergence (MACD) indicator stays above its signal line amid the expanding green histogram bars on the daily chart, suggesting buyers retain momentum after the rebound. Moreover, the Relative Strength Index (RSI) is around 53 and points higher on the same chart, indicating improving but not extreme upside pressure.
Despite this short-term bullish outlook, spot remains far below the 50-day, 100-day, and 200-day Exponential Moving Averages (EMAs), which are clustered between roughly $73,000 and $88,900, indicating BTC remains within a broader corrective phase rather than a confirmed uptrend.
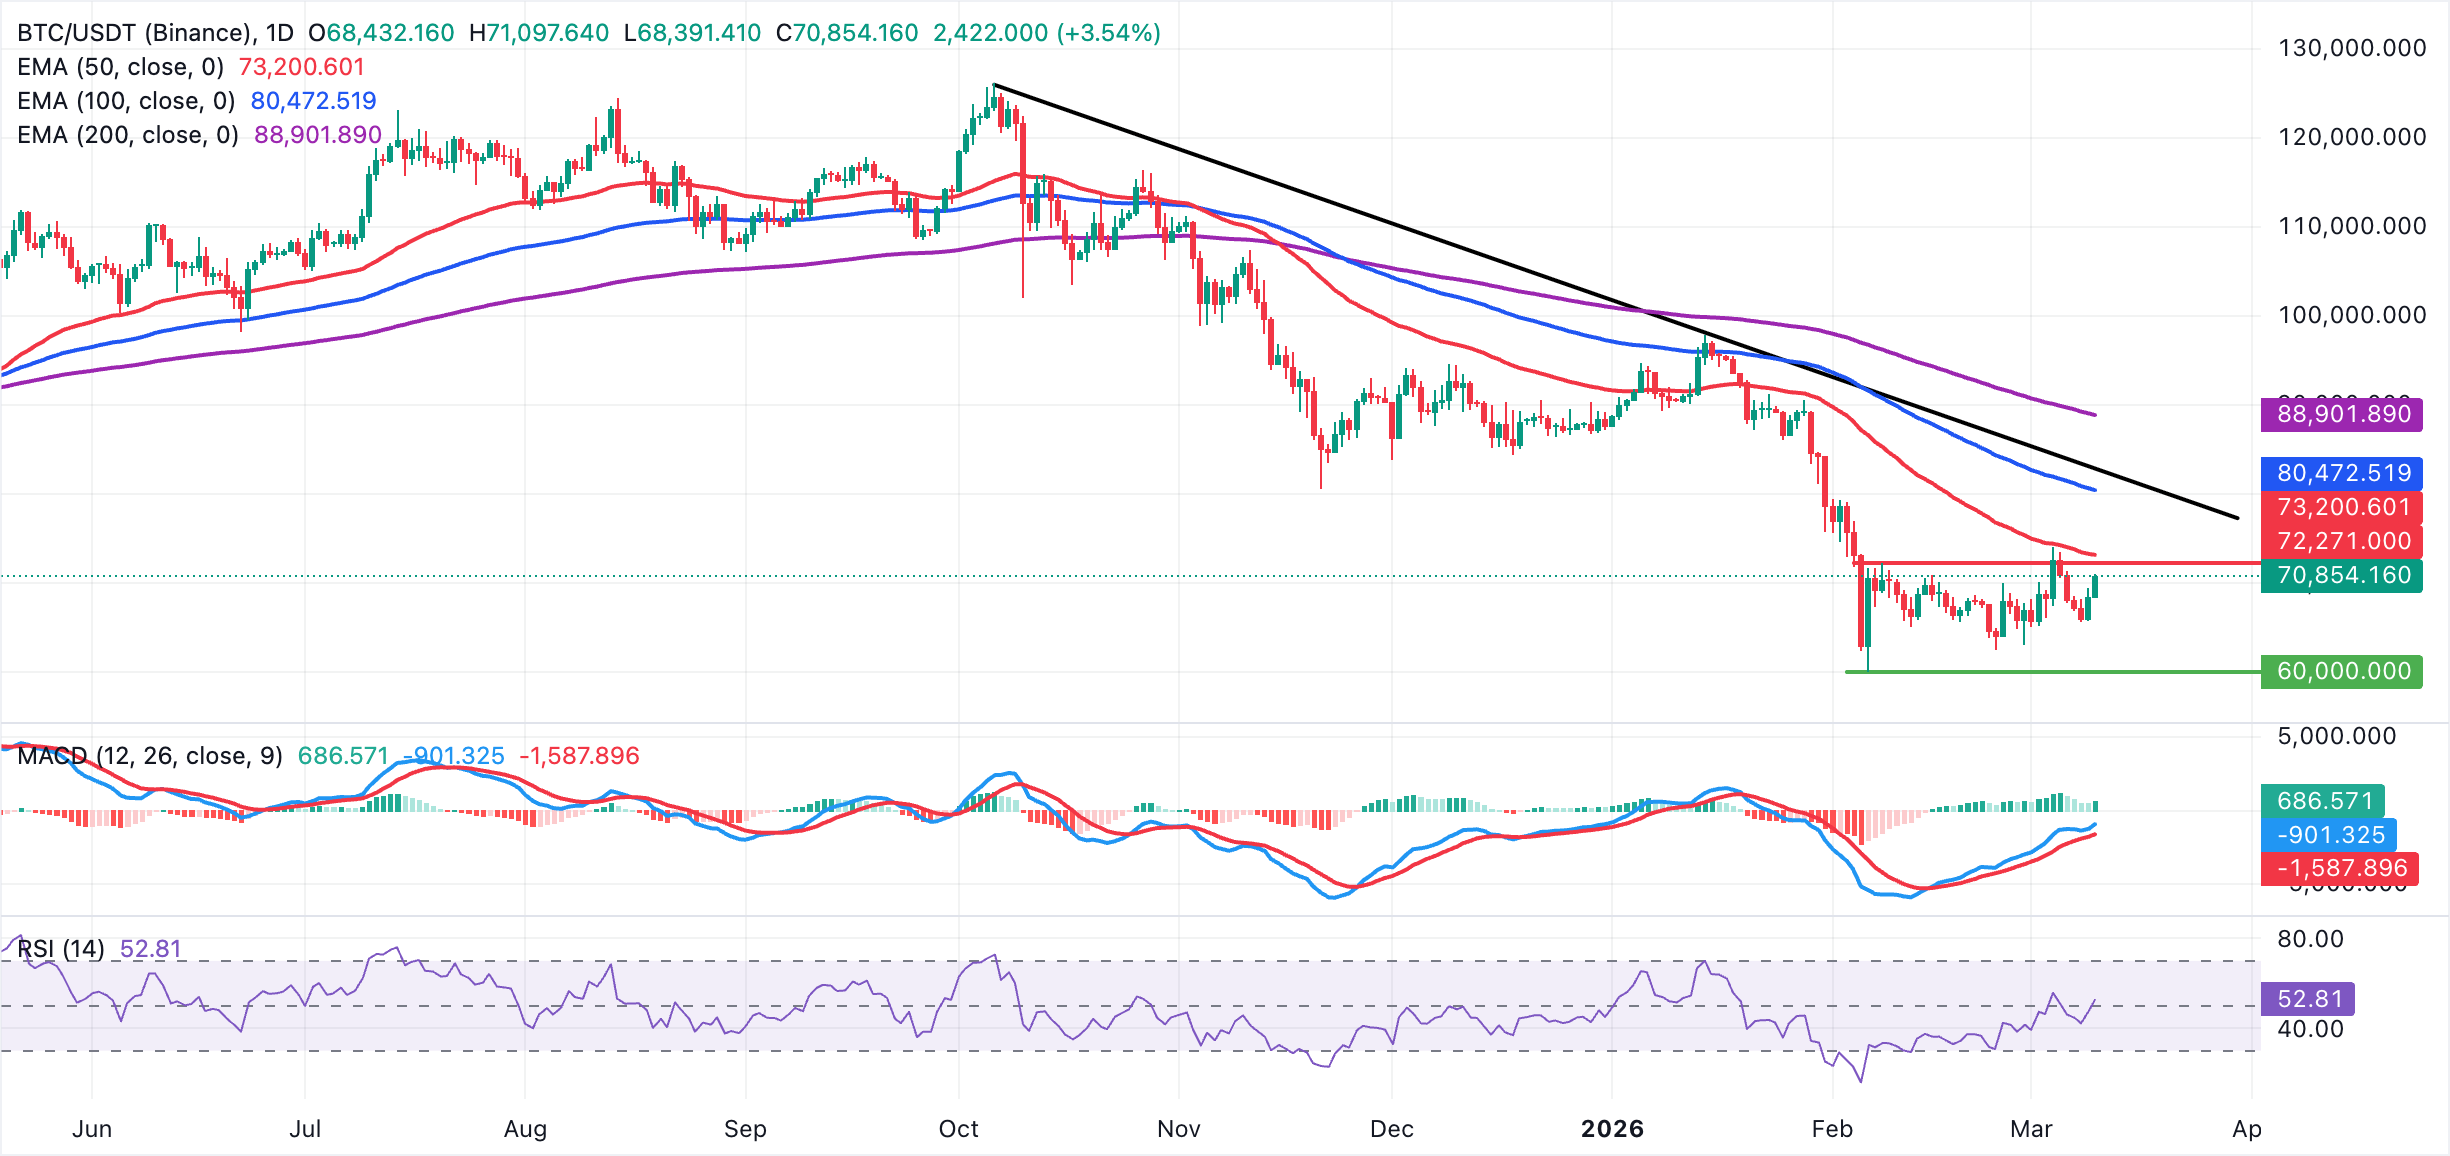
Initial resistance emerges around the upper end of the range at $72,271. Above this level lies the 50-day EMA at $73,200. A daily close above this area would open the door toward the 100-day EMA at $80,473. On the downside, immediate support is at the $68,391 daily low, followed by the weekly open at $65,971.
As long as BTC holds above $65,971, short-term dips are set within a recovery phase, but failure there would shift the focus back to the broader downtrend defined by the overhead moving averages.
Altcoins technical outlook: Ethereum and XRP rebound
Ethereum remains above $2,000 as bulls tighten their grip, supported by improving sentiment in the broader crypto market. The MACD indicator holds above its signal line on the daily chart, while green histogram bars expand, confirming a potential bullish shift. The RSI at 51 has crossed above the neutral line on the same chart, upholding ETH's short-term positive thesis.
Meanwhile, initial resistance lies around Friday's high at $2,093, followed by a stronger barrier at the 50-day EMA at $2,234. A daily close above the moving average resistance would be needed to weaken the bearish tone and open the way toward the 100-day EMA at $2,567.
On the downside, immediate support emerges at $2,000, guarding the more important floor at $1,930, which aligns with Monday's low. A break below $1,930 would expose the $1,800 demand area next and reinstate heavier selling pressure within the prevailing downtrend.
-1773135771613-1773135771616.png)
As for XRP, the price edges higher above $1.41 as crypto prices generally recover. Key momentum indicators back the remittance token's short-term positive outlook, including the MACD and the RSI. The MACD indicator holds above its signal line on the daily chart, with green histogram bars expanding, prompting traders to lean into risk and increase their exposure. Moreover, the RSI on the same chart is rising near the 50 midline, reinforcing upside momentum.
-1773136552165-1773136552167.png)
Despite the short-term positive outlook, initial resistance emerges around Thursday's high at $1.45, with a daily close above this level needed to open the way toward the 50-day EMA at $1.53. On the downside, immediate support lies at $1.36, the recent swing low, followed by the weekly low at $1.33, where a break would expose deeper retracements toward the $1.25 area.
Crypto ETF FAQs
An Exchange-Traded Fund (ETF) is an investment vehicle or an index that tracks the price of an underlying asset. ETFs can not only track a single asset, but a group of assets and sectors. For example, a Bitcoin ETF tracks Bitcoin’s price. ETF is a tool used by investors to gain exposure to a certain asset.
Yes. The first Bitcoin futures ETF in the US was approved by the US Securities & Exchange Commission in October 2021. A total of seven Bitcoin futures ETFs have been approved, with more than 20 still waiting for the regulator’s permission. The SEC says that the cryptocurrency industry is new and subject to manipulation, which is why it has been delaying crypto-related futures ETFs for the last few years.
Yes. The SEC approved in January 2024 the listing and trading of several Bitcoin spot Exchange-Traded Funds, opening the door to institutional capital and mainstream investors to trade the main crypto currency. The decision was hailed by the industry as a game changer.
The main advantage of crypto ETFs is the possibility of gaining exposure to a cryptocurrency without ownership, reducing the risk and cost of holding the asset. Other pros are a lower learning curve and higher security for investors since ETFs take charge of securing the underlying asset holdings. As for the main drawbacks, the main one is that as an investor you can’t have direct ownership of the asset, or, as they say in crypto, “not your keys, not your coins.” Other disadvantages are higher costs associated with holding crypto since ETFs charge fees for active management. Finally, even though investing in ETFs reduces the risk of holding an asset, price swings in the underlying cryptocurrency are likely to be reflected in the investment vehicle too.
(The technical analysis of this story was written with the help of an AI tool.)
Author

John Isige
FXStreet
John Isige is a seasoned cryptocurrency journalist and markets analyst committed to delivering high-quality, actionable insights tailored to traders, investors, and crypto enthusiasts. He enjoys deep dives into emerging Web3 tren


