Crypto Today: Bitcoin, Ethereum, XRP ease amid cooling retail demand
- Bitcoin trades near key resistance at $78,000 after its rebound stalled, weighed down by fading retail demand.
- Ethereum extends its decline for the second consecutive day, testing support at $2,300 as futures Open Interest narrows to $30.98 billion.
- XRP remains range-bound, aligning with the consolidating momentum indicators.

Bitcoin (BTC) is trading just below the critical $78,000 resistance at the time of writing on Friday. This pivotal level continues to shape BTC’s outlook, with a sustained break above it likely to open the door to gains above $80,000. On the other hand, remaining below the immediate resistance could reinstate the bearish outlook.
Altcoins, including Ethereum (ETH) and Ripple (XRP), appear to be extending their drawdown from weekly highs of $2,424 and $1.46, respectively.
Retail demand cools as BTC, ETH and XRP falter
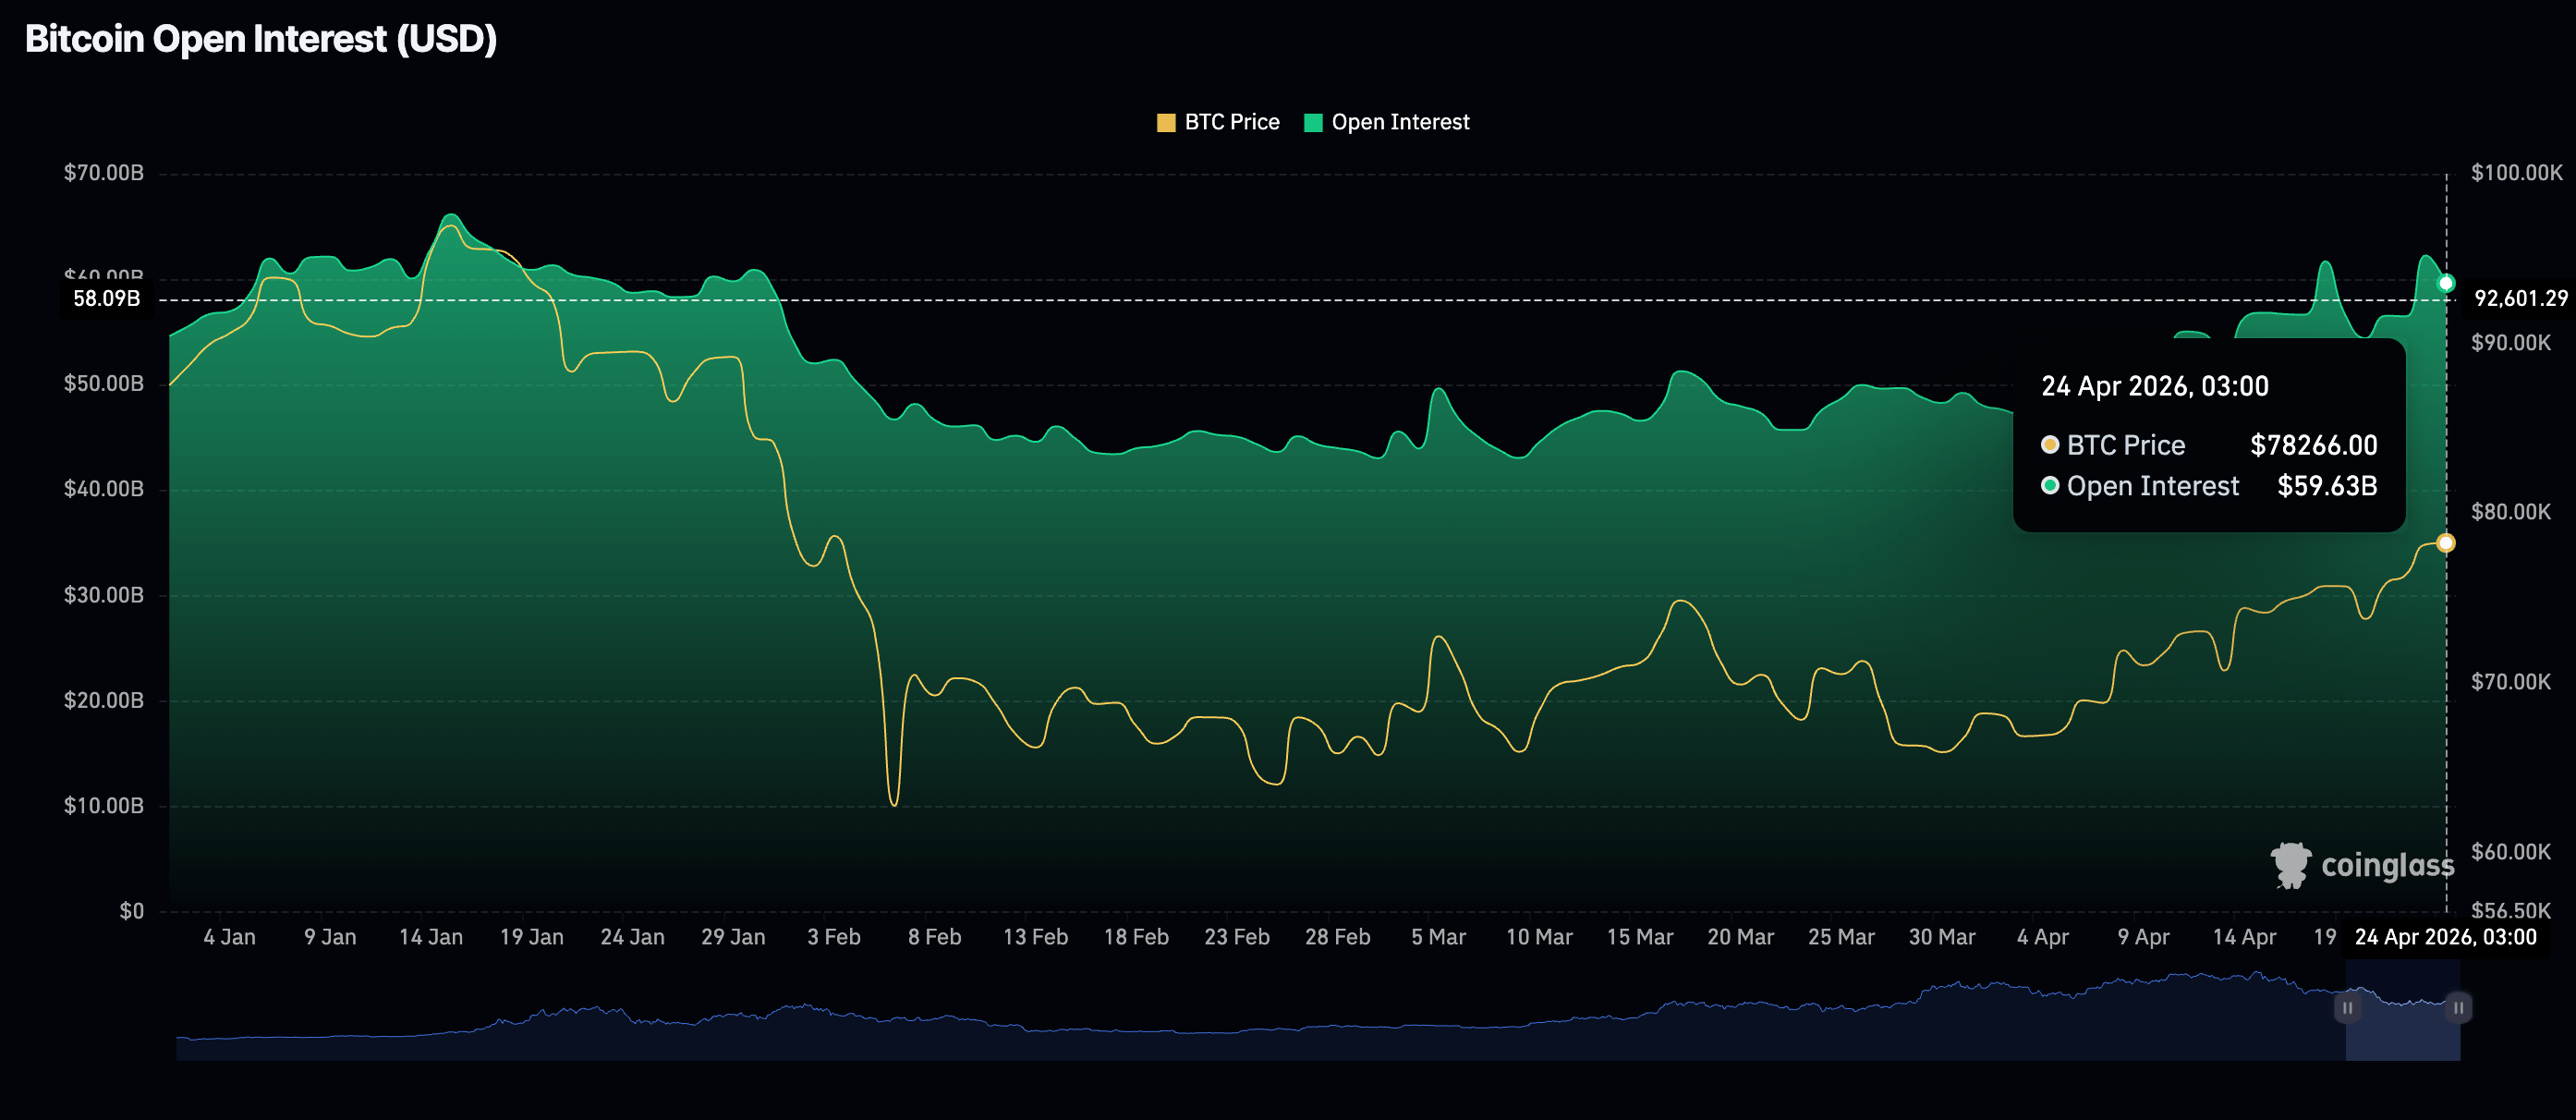
Retail interest in Bitcoin is losing momentum, as the perpetual futures Open Interest (OI) shrinks to $59.63 billion on Friday, from $62.67 billion the previous day.
A gradual increase in the OI from its lowest monthly level of $46.40 on April 4, coinciding with Bitcoin’s surge above $79,000 this week, underscores the tailwind from retail investors. If the current correction persists, overhead pressure could limit BTC’s recovery pressure and deepen the pullback.
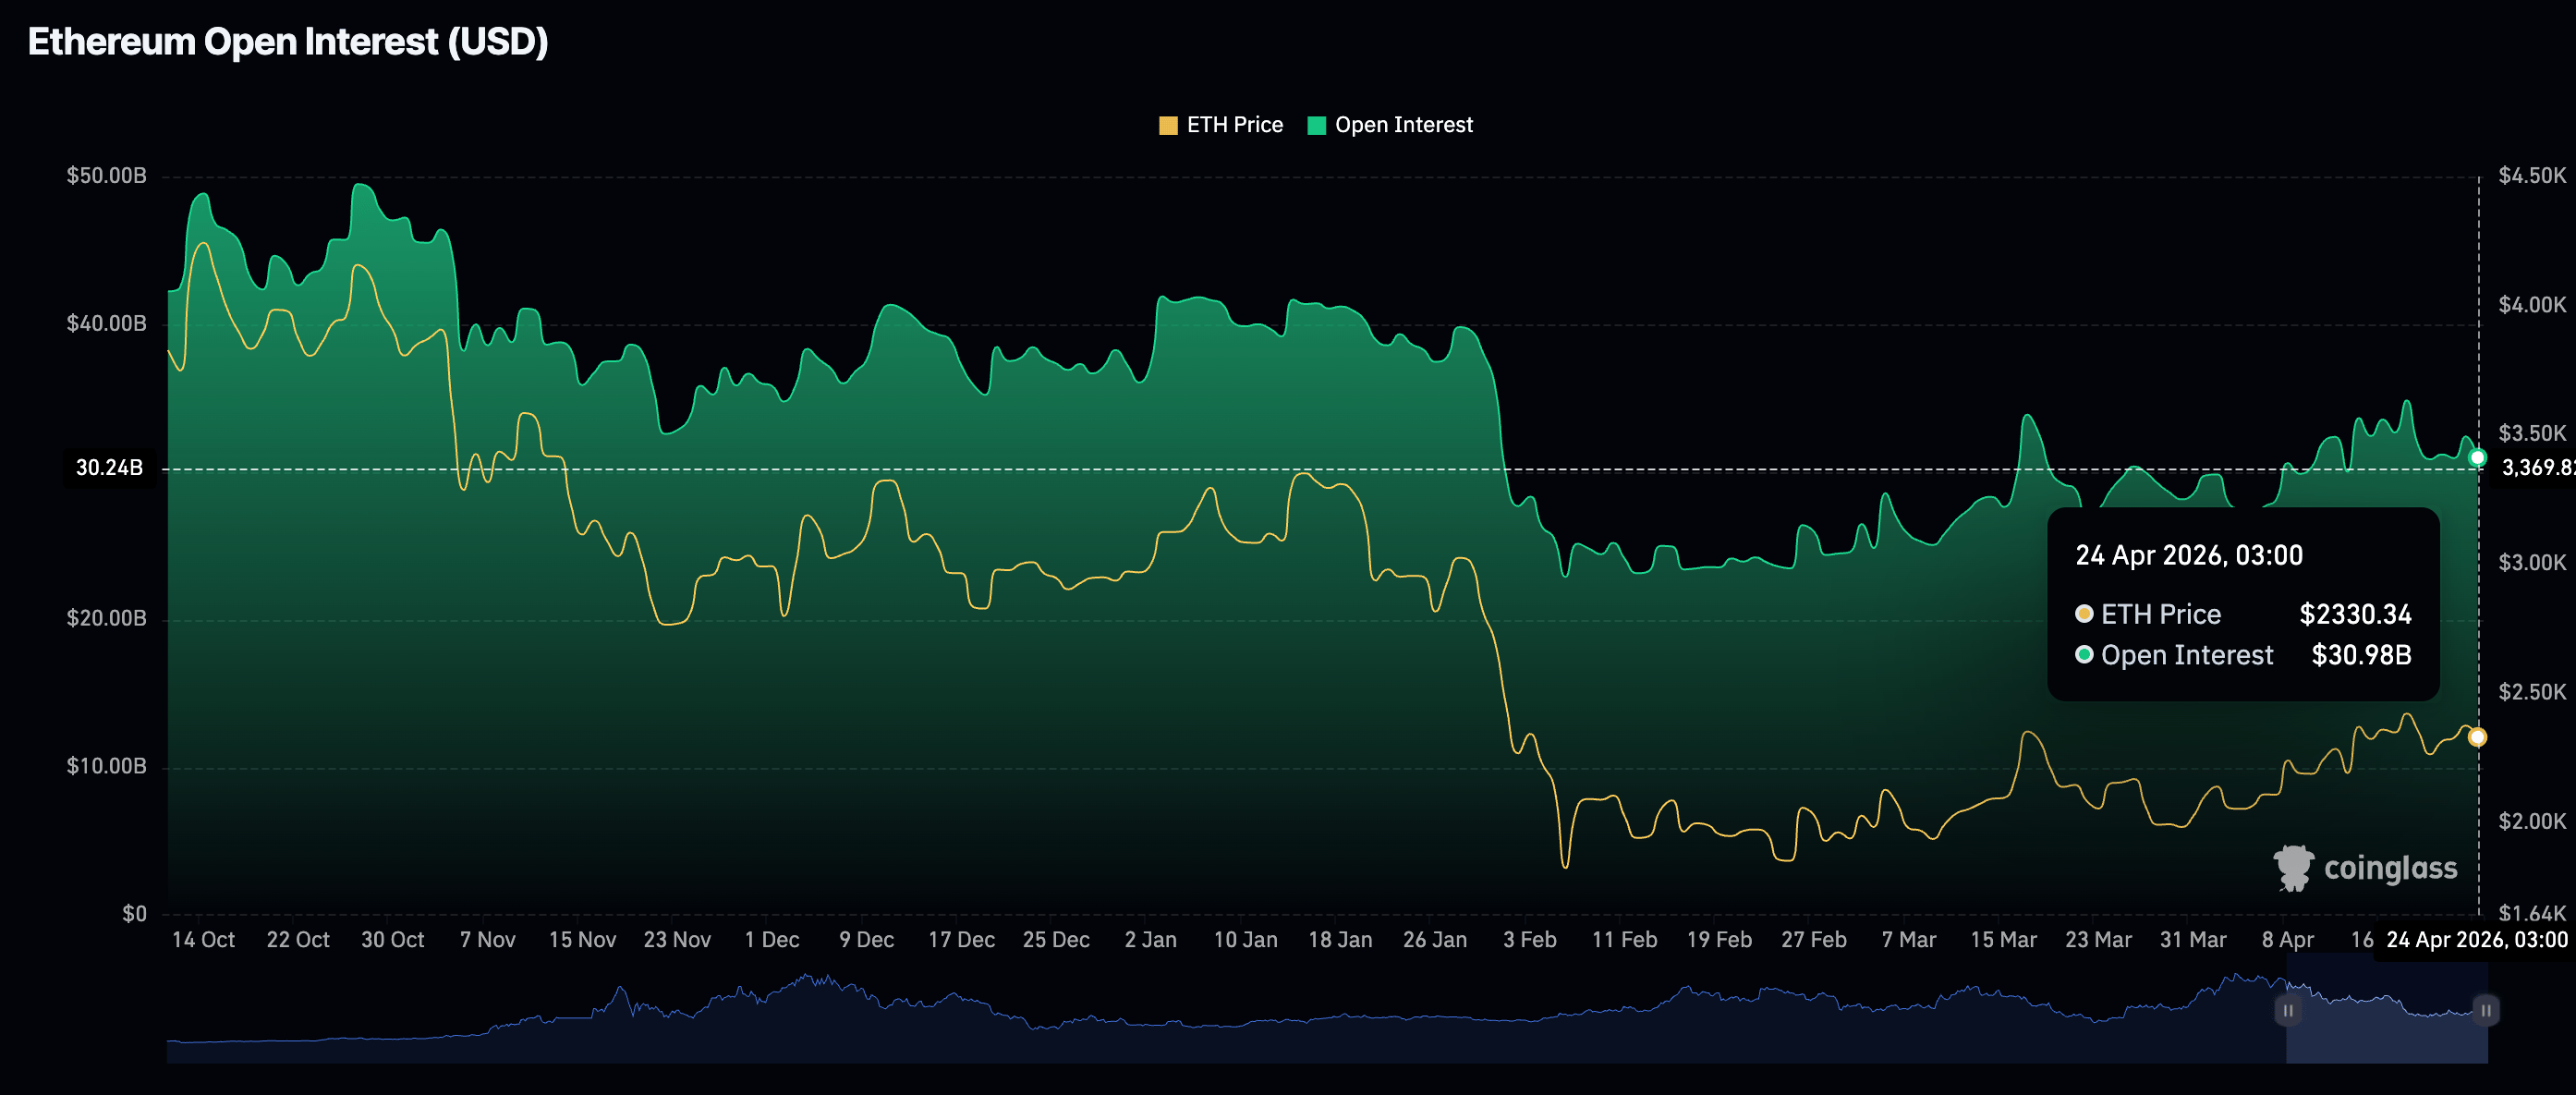
The drawdown in the Ethereum futures OI to $30.98 billion on Friday, from its weekly peak of $32.41 billion the previous day, undermines retail demand. It also shows that investors are losing conviction in ETH’s ability to sustain the recovery, as more traders close positions rather than open new ones.
Meanwhile, demand for XRP derivatives remains on the back foot, with the perpetual OI averaging $2.57 billion on Friday. The OI has remained relatively steady at this level since Monday after fading from $2.80 billion, which marked the monthly peak. Therefore, sustaining recovery in XRP could be an uphill battle, leaving the remittance token largely susceptible to sell-side pressure.
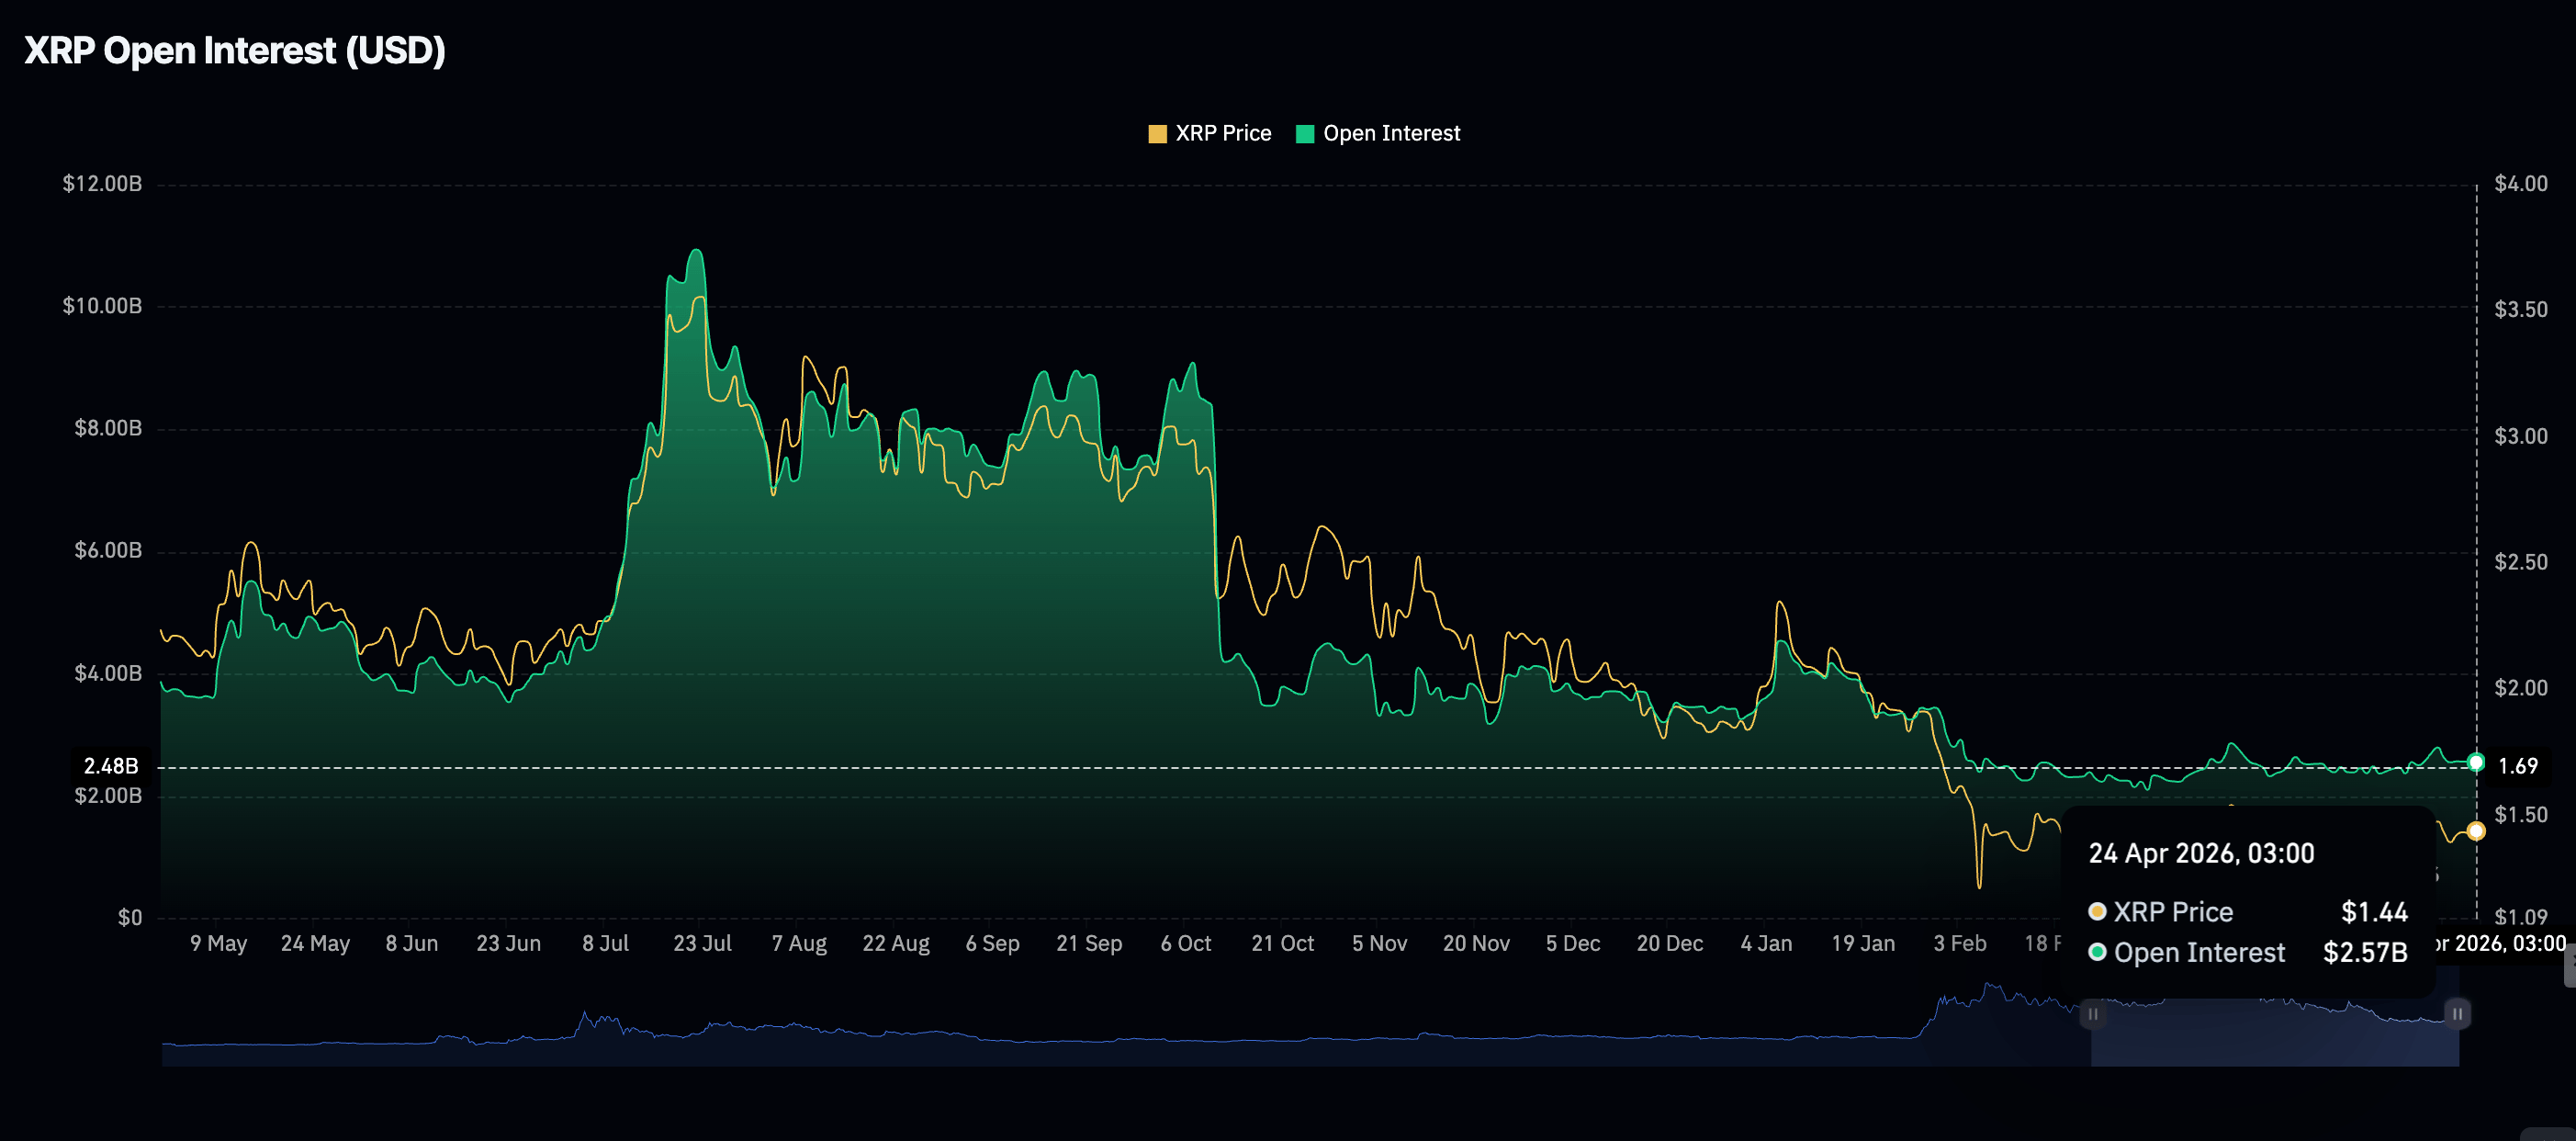
Chart of the day: Bitcoin upside stalls as correction looms
Bitcoin trades at $77,799, consolidating its advance above the medium-term Exponential Moving Averages (EMAs) and keeping a constructive bullish bias. The pair holds firmly above the 50-day EMA at $72,789 and the 100-day EMA at $75,484, with the rising trendline now acting as a reinforced demand band.
Momentum metrics back the upside tone, as the Relative Strength Index (RSI) hovers in bullish territory near 64 on the daily chart, while the Moving Average Convergence Divergence (MACD) histogram remains positive. However, the elevated Money Flow Index (MFI) in the high 70s hints at overbought conditions that could slow gains.
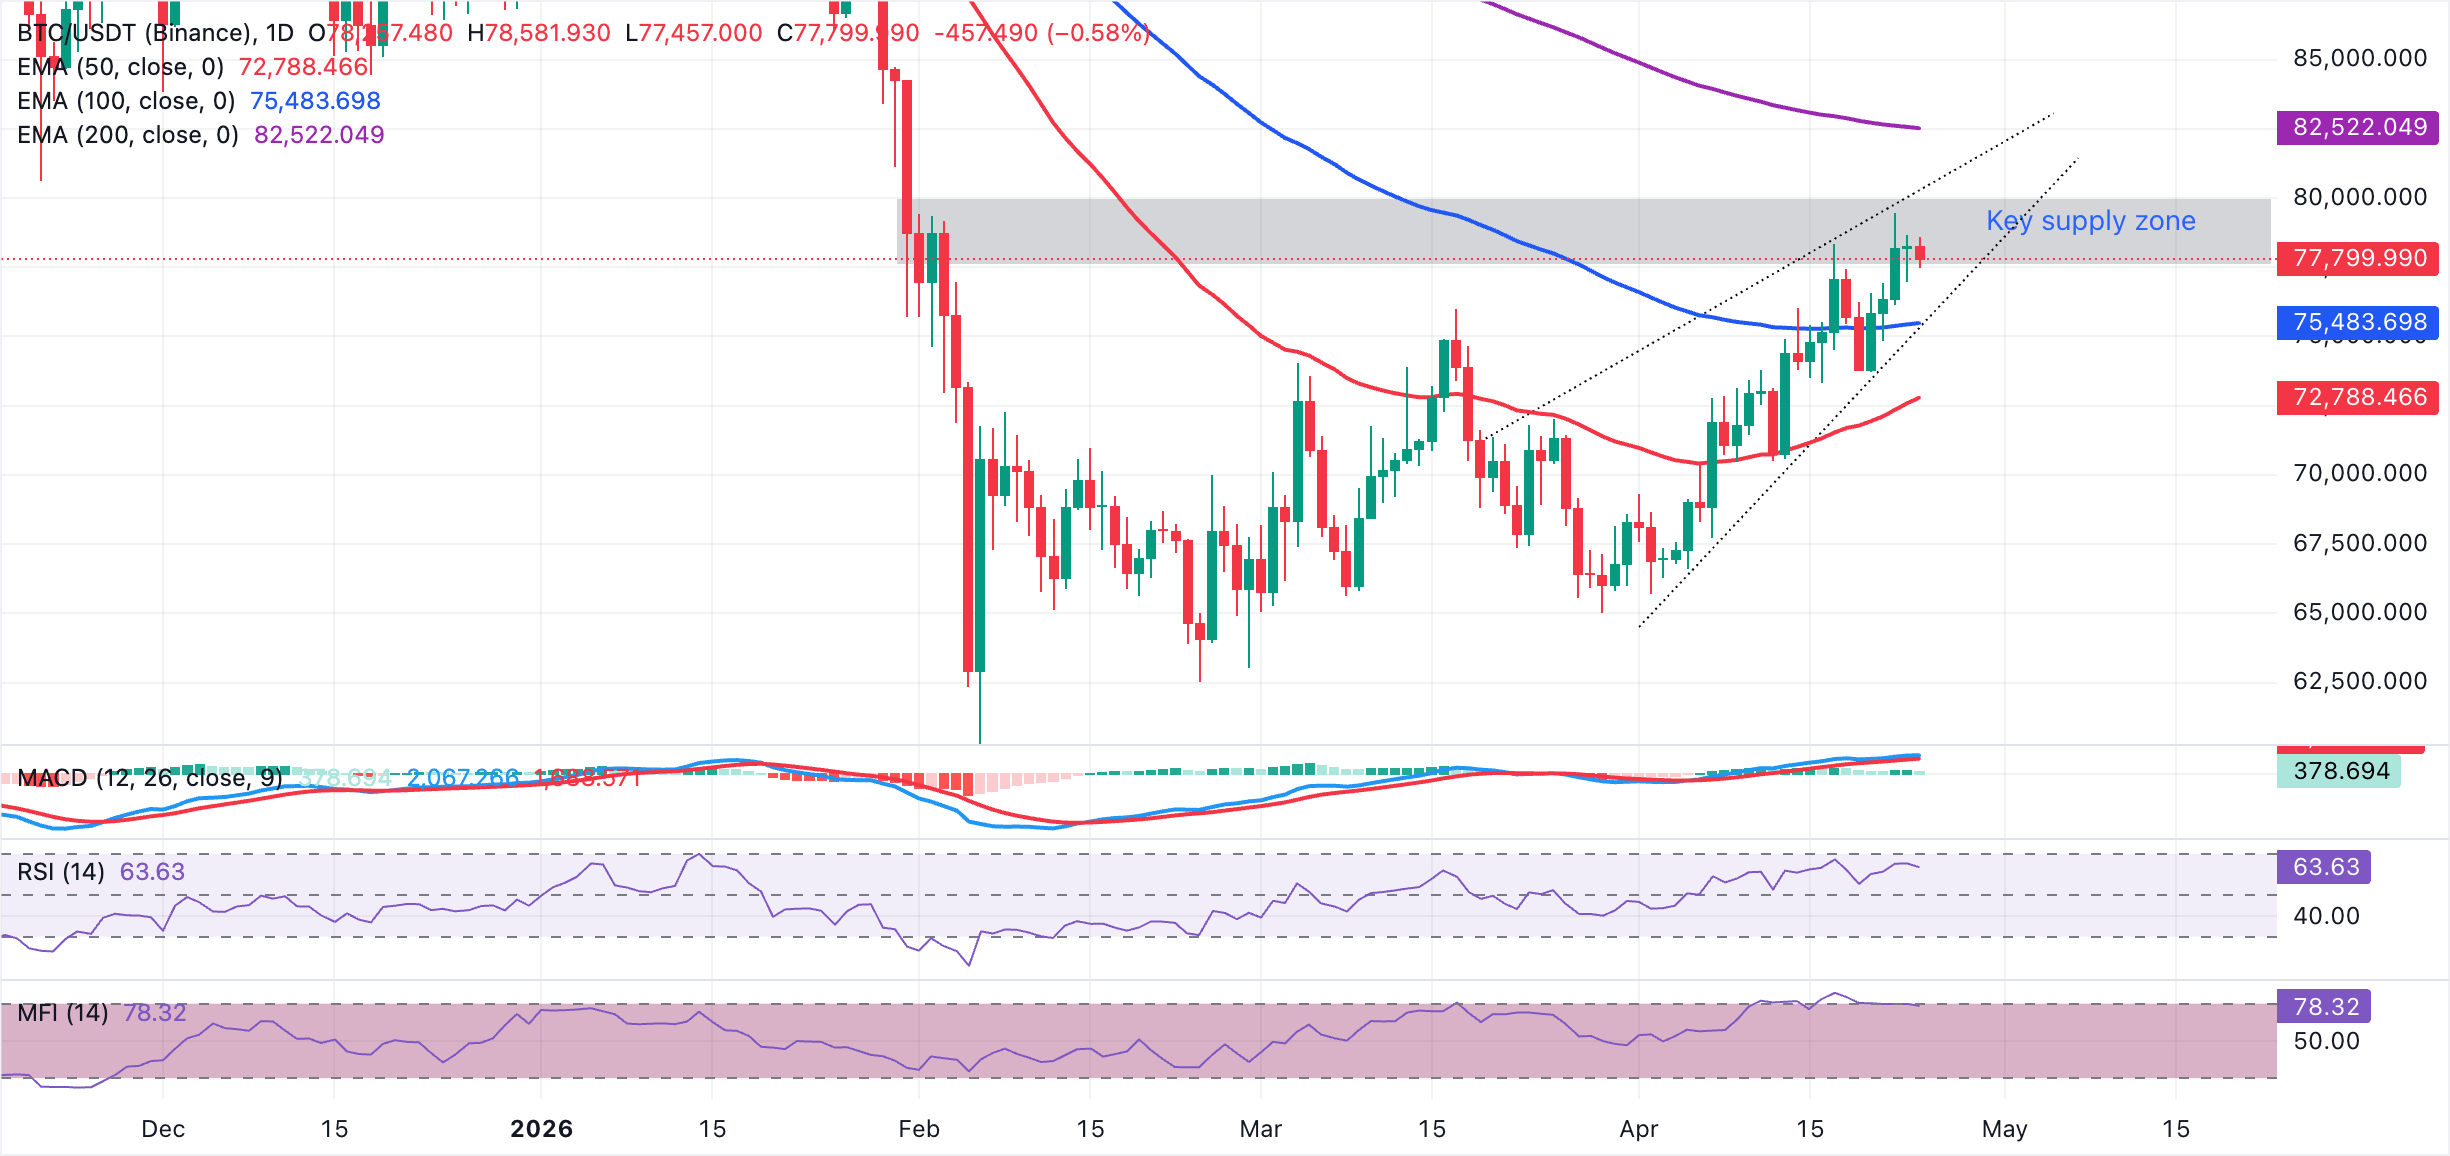
On the topside, the next notable hurdles are the immediate $78,000 supply zone, followed by the 200-day EMA at $82,522. Both stand as the first major resistance that bulls would need to clear to extend the uptrend. On the downside, initial support is at $75,484, where the 100-day EMA meets the rising trendline, ahead of the 50-day EMA at $72,788.
Altcoins technical outlook: Ethereum and XRP trade under pressure
Ethereum trades at $2,317, holding above the 50-day EMA at $2,230 and the prior downward resistance trendline break near $2,310, tilting the near-term bias slightly in favor of the bulls while it consolidates under heavier overhead levels. The RSI at 54 on the daily chart hints at modest positive pressure. Still, the MACD histogram has slipped into negative territory, suggesting that upside attempts may lack strong follow-through unless fresh buying interest emerges.
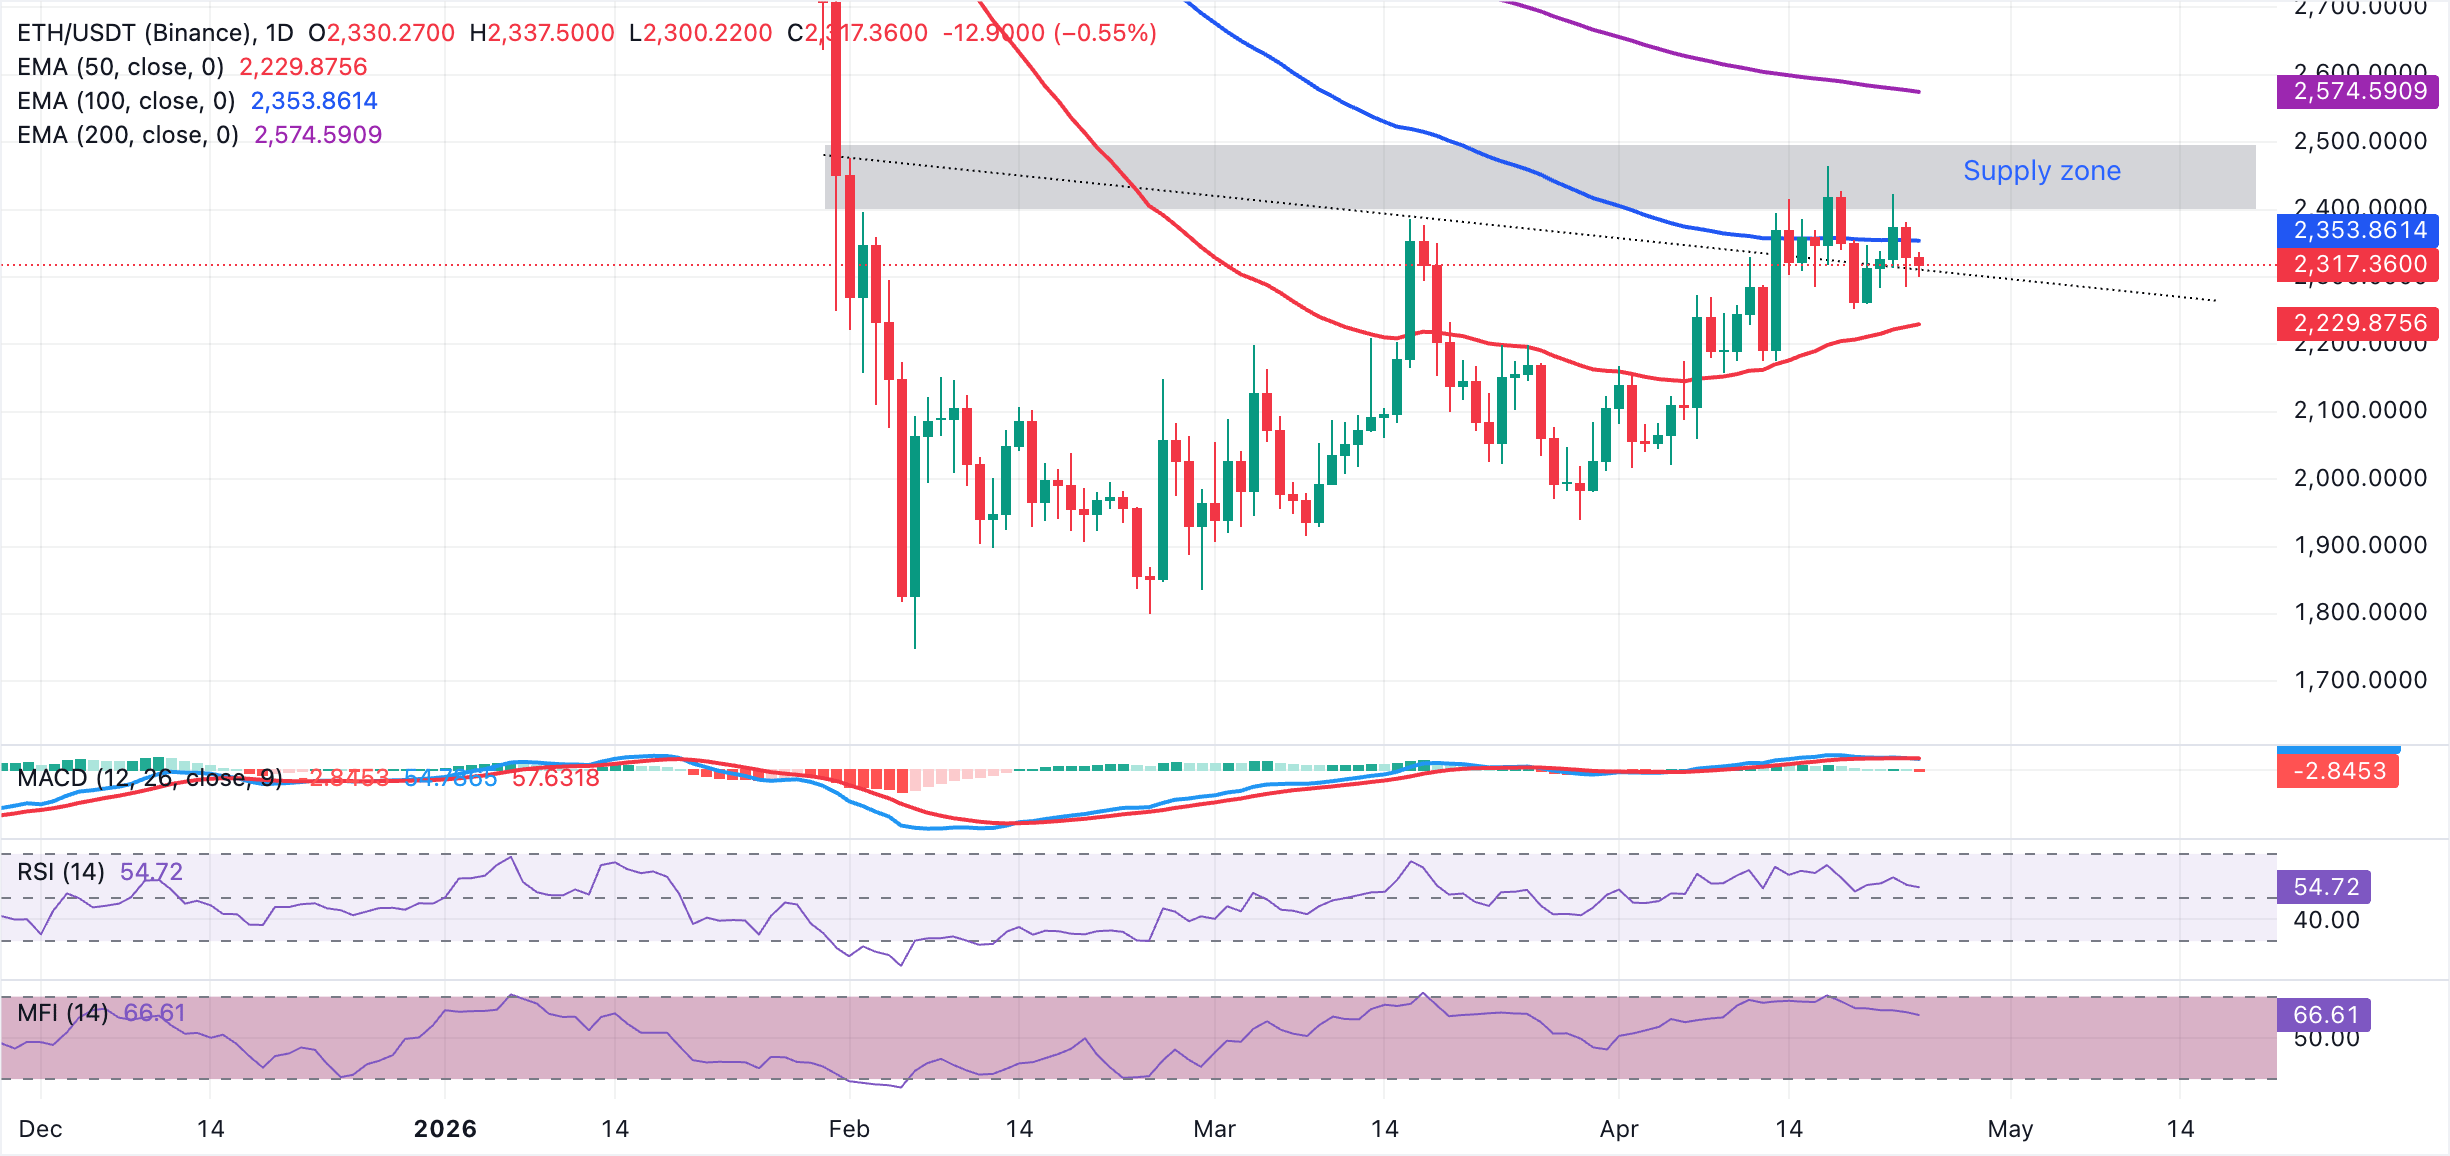
On the topside, immediate resistance lies at the 100-day EMA around $2,354. A decisive daily close above this barrier would open the way toward the more significant 200-day EMA at $2,575, where the broader downtrend remains intact. On the downside, initial support is seen at the recent trendline break level near $2,310, with the 50-day EMA at $2,230 providing a more important technical floor.
Meanwhile, XRP trades at $1.43, holding a neutral‑bullish near‑term bias as price sits above the 50-day EMA at $1.41 and the Bollinger Bands’ 20-day Simple Moving Average (SMA) at $1.39. Momentum conditions are constructive, with the RSI around 56 on the daily chart and the MACD in positive territory. Moreover, the MFI near 74 warns that buying pressure is becoming stretched as price grinds higher within the upper half of the Bollinger envelope.
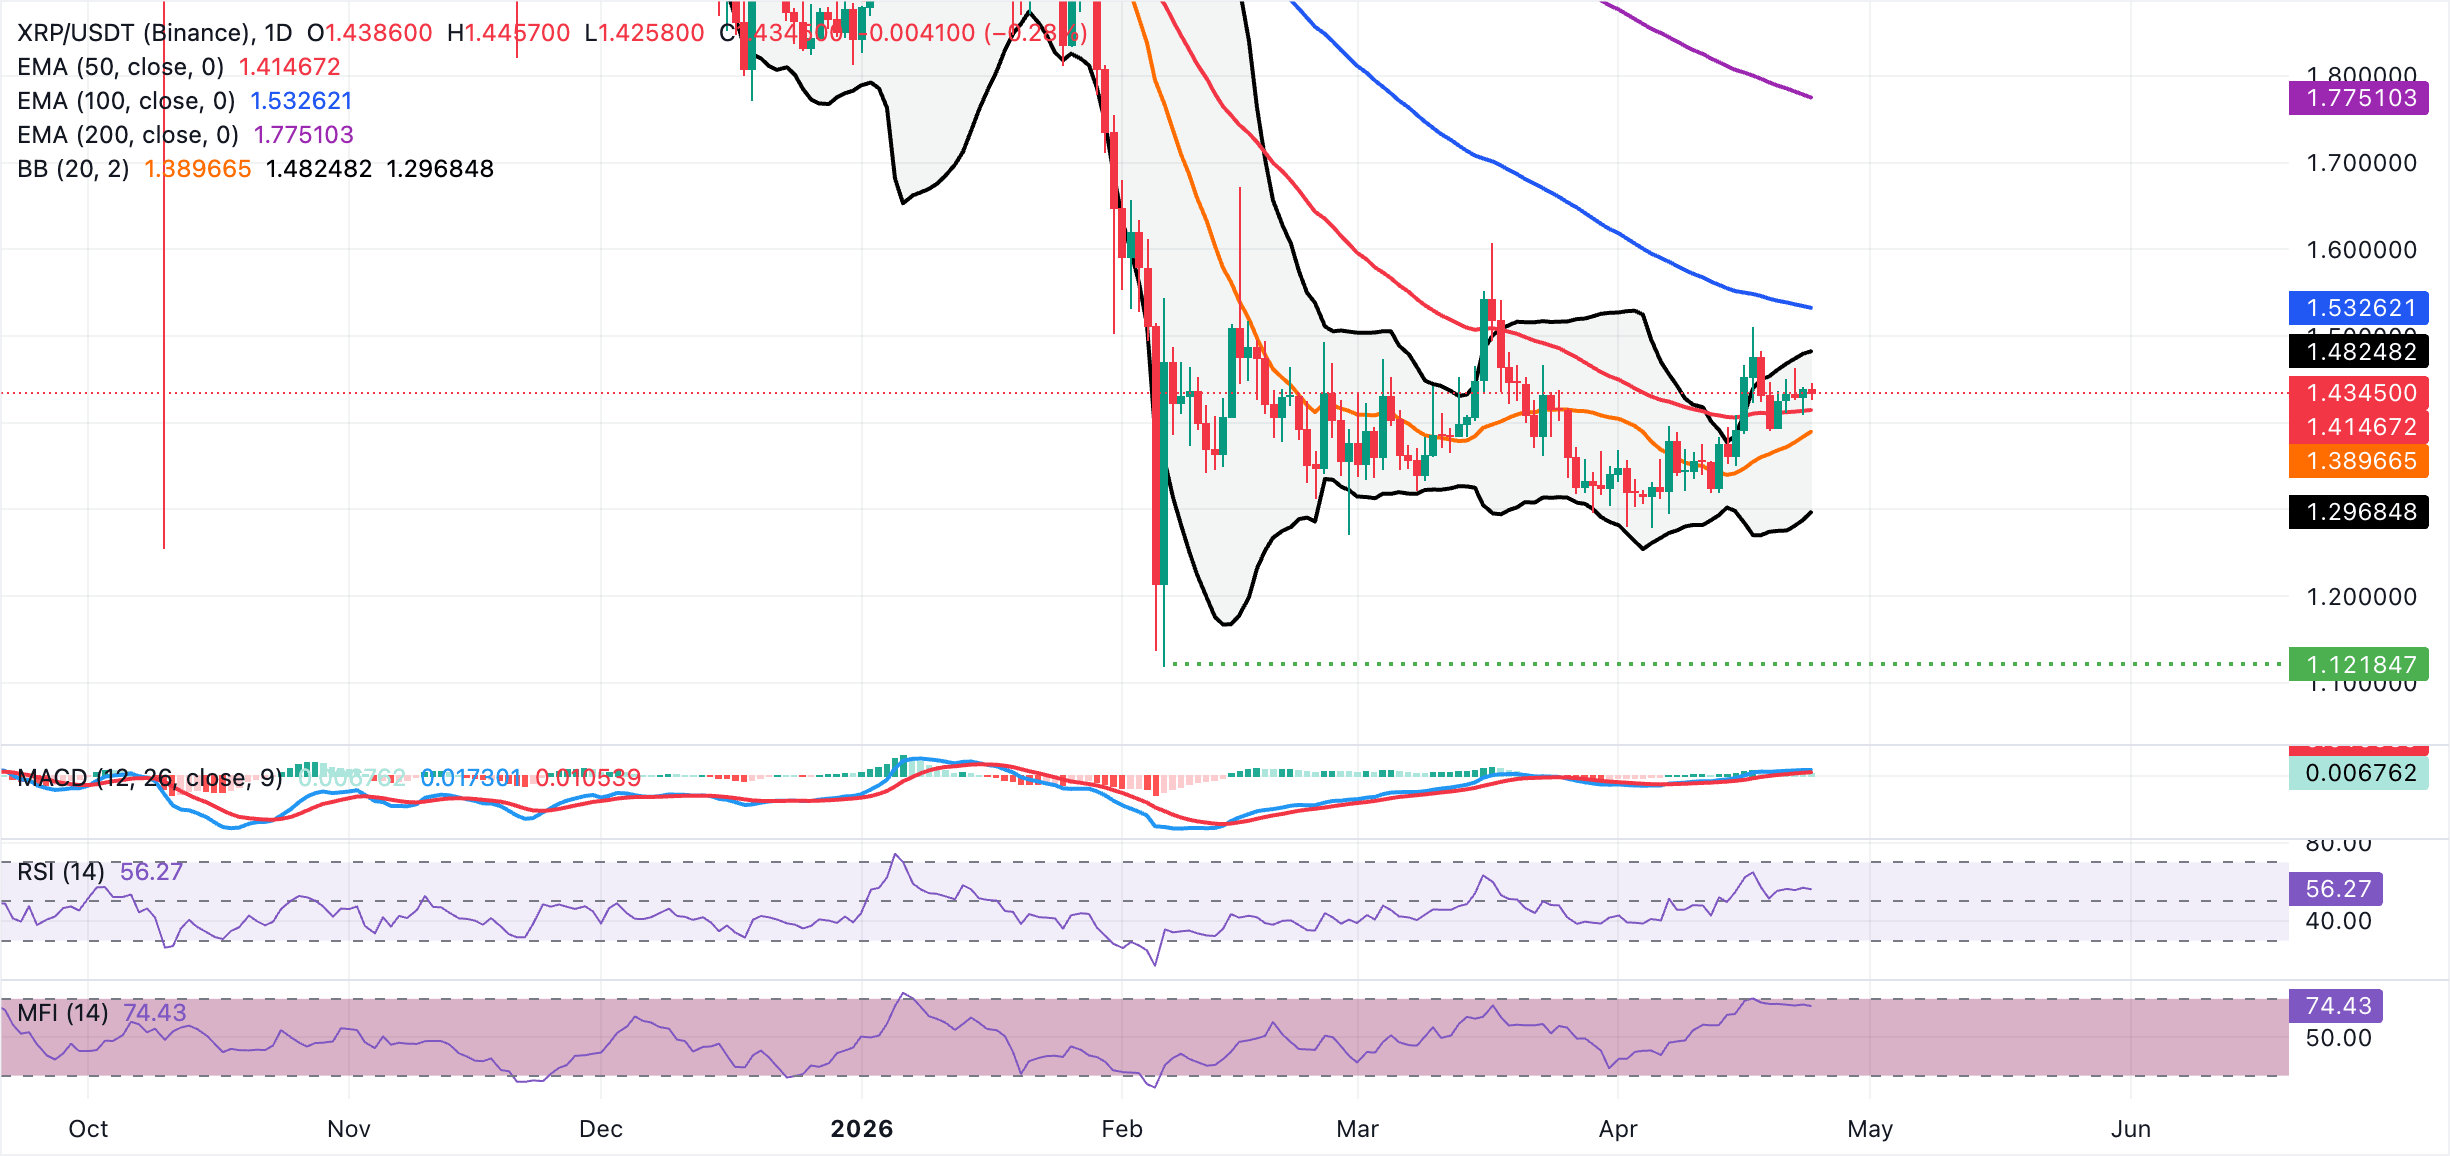
On the topside, immediate resistance is aligned at the Bollinger upper band around $1.48, where a clear daily close above would open the way toward the 100-day EMA at $1.53, ahead of a more distant barrier at the 200-day EMA near $1.77. On the downside, initial support is seen at the current area and day’s open near $1.43, followed by the 50-day EMA at $1.41 and then the Bollinger midline around $1.39. A break beneath this latter zone would expose the lower Bollinger band support close to $1.30 and signal a deeper corrective phase.
(The technical analysis of this story was written with the help of an AI tool.)
Open Interest, funding rate FAQs
Higher Open Interest is associated with higher liquidity and new capital inflow to the market. This is considered the equivalent of increase in efficiency and the ongoing trend continues. When Open Interest decreases, it is considered a sign of liquidation in the market, investors are leaving and the overall demand for an asset is on a decline, fueling a bearish sentiment among investors.
Funding fees bridge the difference between spot prices and prices of futures contracts of an asset by increasing liquidation risks faced by traders. A consistently high and positive funding rate implies there is a bullish sentiment among market participants and there is an expectation of a price hike. A consistently negative funding rate for an asset implies a bearish sentiment, indicating that traders expect the cryptocurrency’s price to fall and a bearish trend reversal is likely to occur.
Author

John Isige
FXStreet
John Isige is a seasoned cryptocurrency journalist and markets analyst committed to delivering high-quality, actionable insights tailored to traders, investors, and crypto enthusiasts. He enjoys deep dives into emerging Web3 tren



