Crypto Overview: Sellers slow down as Bitcoin holds $76,000 – VVV, LIT, ALGO lead gains
- Bitcoin stabilizes above $76,000 on Wednesday with the 50-day EMA absorbing selling pressure.
- Market volatility cools off as total liquidations in 24 hours drops below $200 million.
- Venice Token, Lighter and Algorand lead gains over the last 24 hours.

The broader cryptocurrency market is stabilizing, with Bitcoin (BTC) holding above $76,000 on Wednesday and liquidations under $200 million over the last 24 hours. Venice Token (VVV), Lighter (LIT), and Algorand (ALGO) emerge as top performers as the broader market volatility softens.
A market-wide cool-off could rebound Bitcoin from $76,000
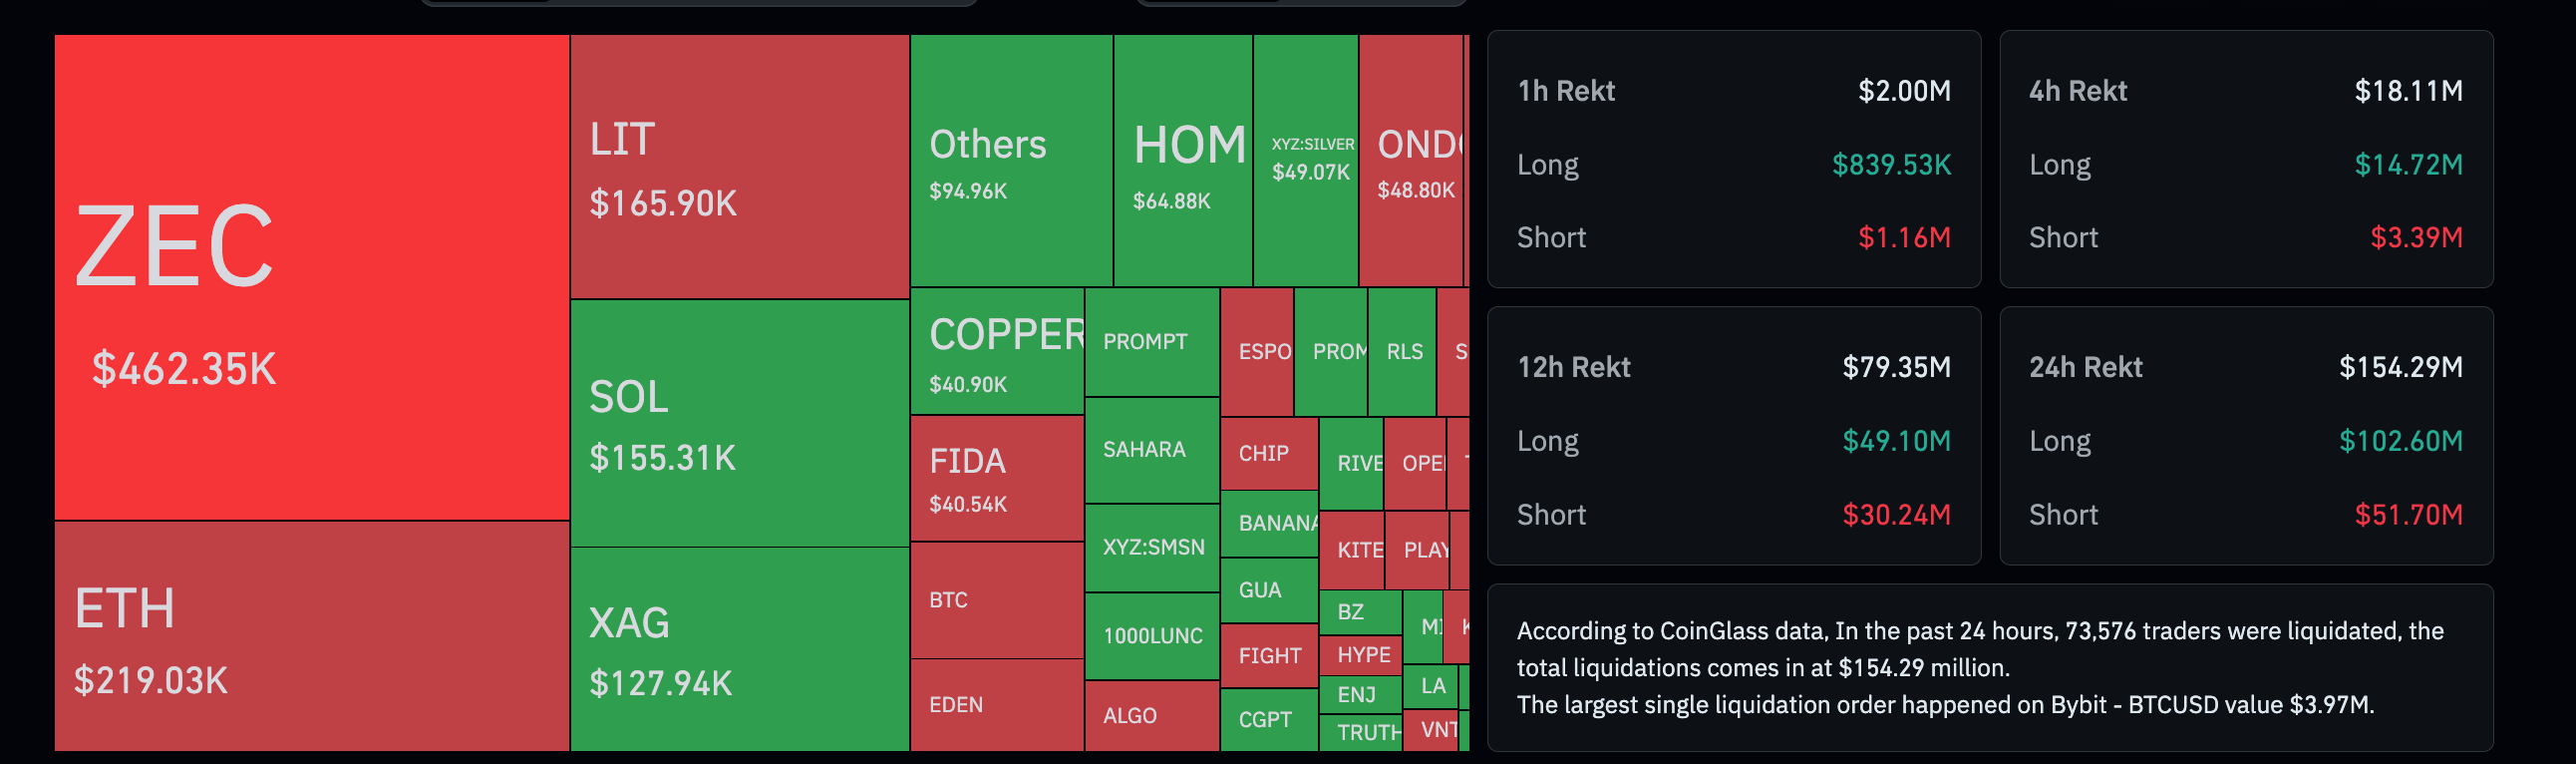
CoinGlass data shows $154 million in total liquidations over the last 24 hours, led by $102 million in long liquidations, suggesting that selling pressure persists but has decreased significantly from $563 million in crypto long liquidations on Monday.
Bitcoin trades around $76,600 at press time on Wednesday, maintaining a mildly bearish near-term tone as it holds below the 50-day Exponential Moving Average (EMA) at $76,736 while remaining well below the 200-day EMA at $82,978.
This configuration suggests rallies are being capped by overhead trend resistance, a view reinforced by a soft Relative Strength Index (RSI) around 44 and a deeply negative Moving Average Convergence Divergence (MACD), which together hint that upside momentum is fading rather than building.
On the downside, structural support is seen near the prior uptrend break at $70,875, where buyers could look to defend the broader rising trend.
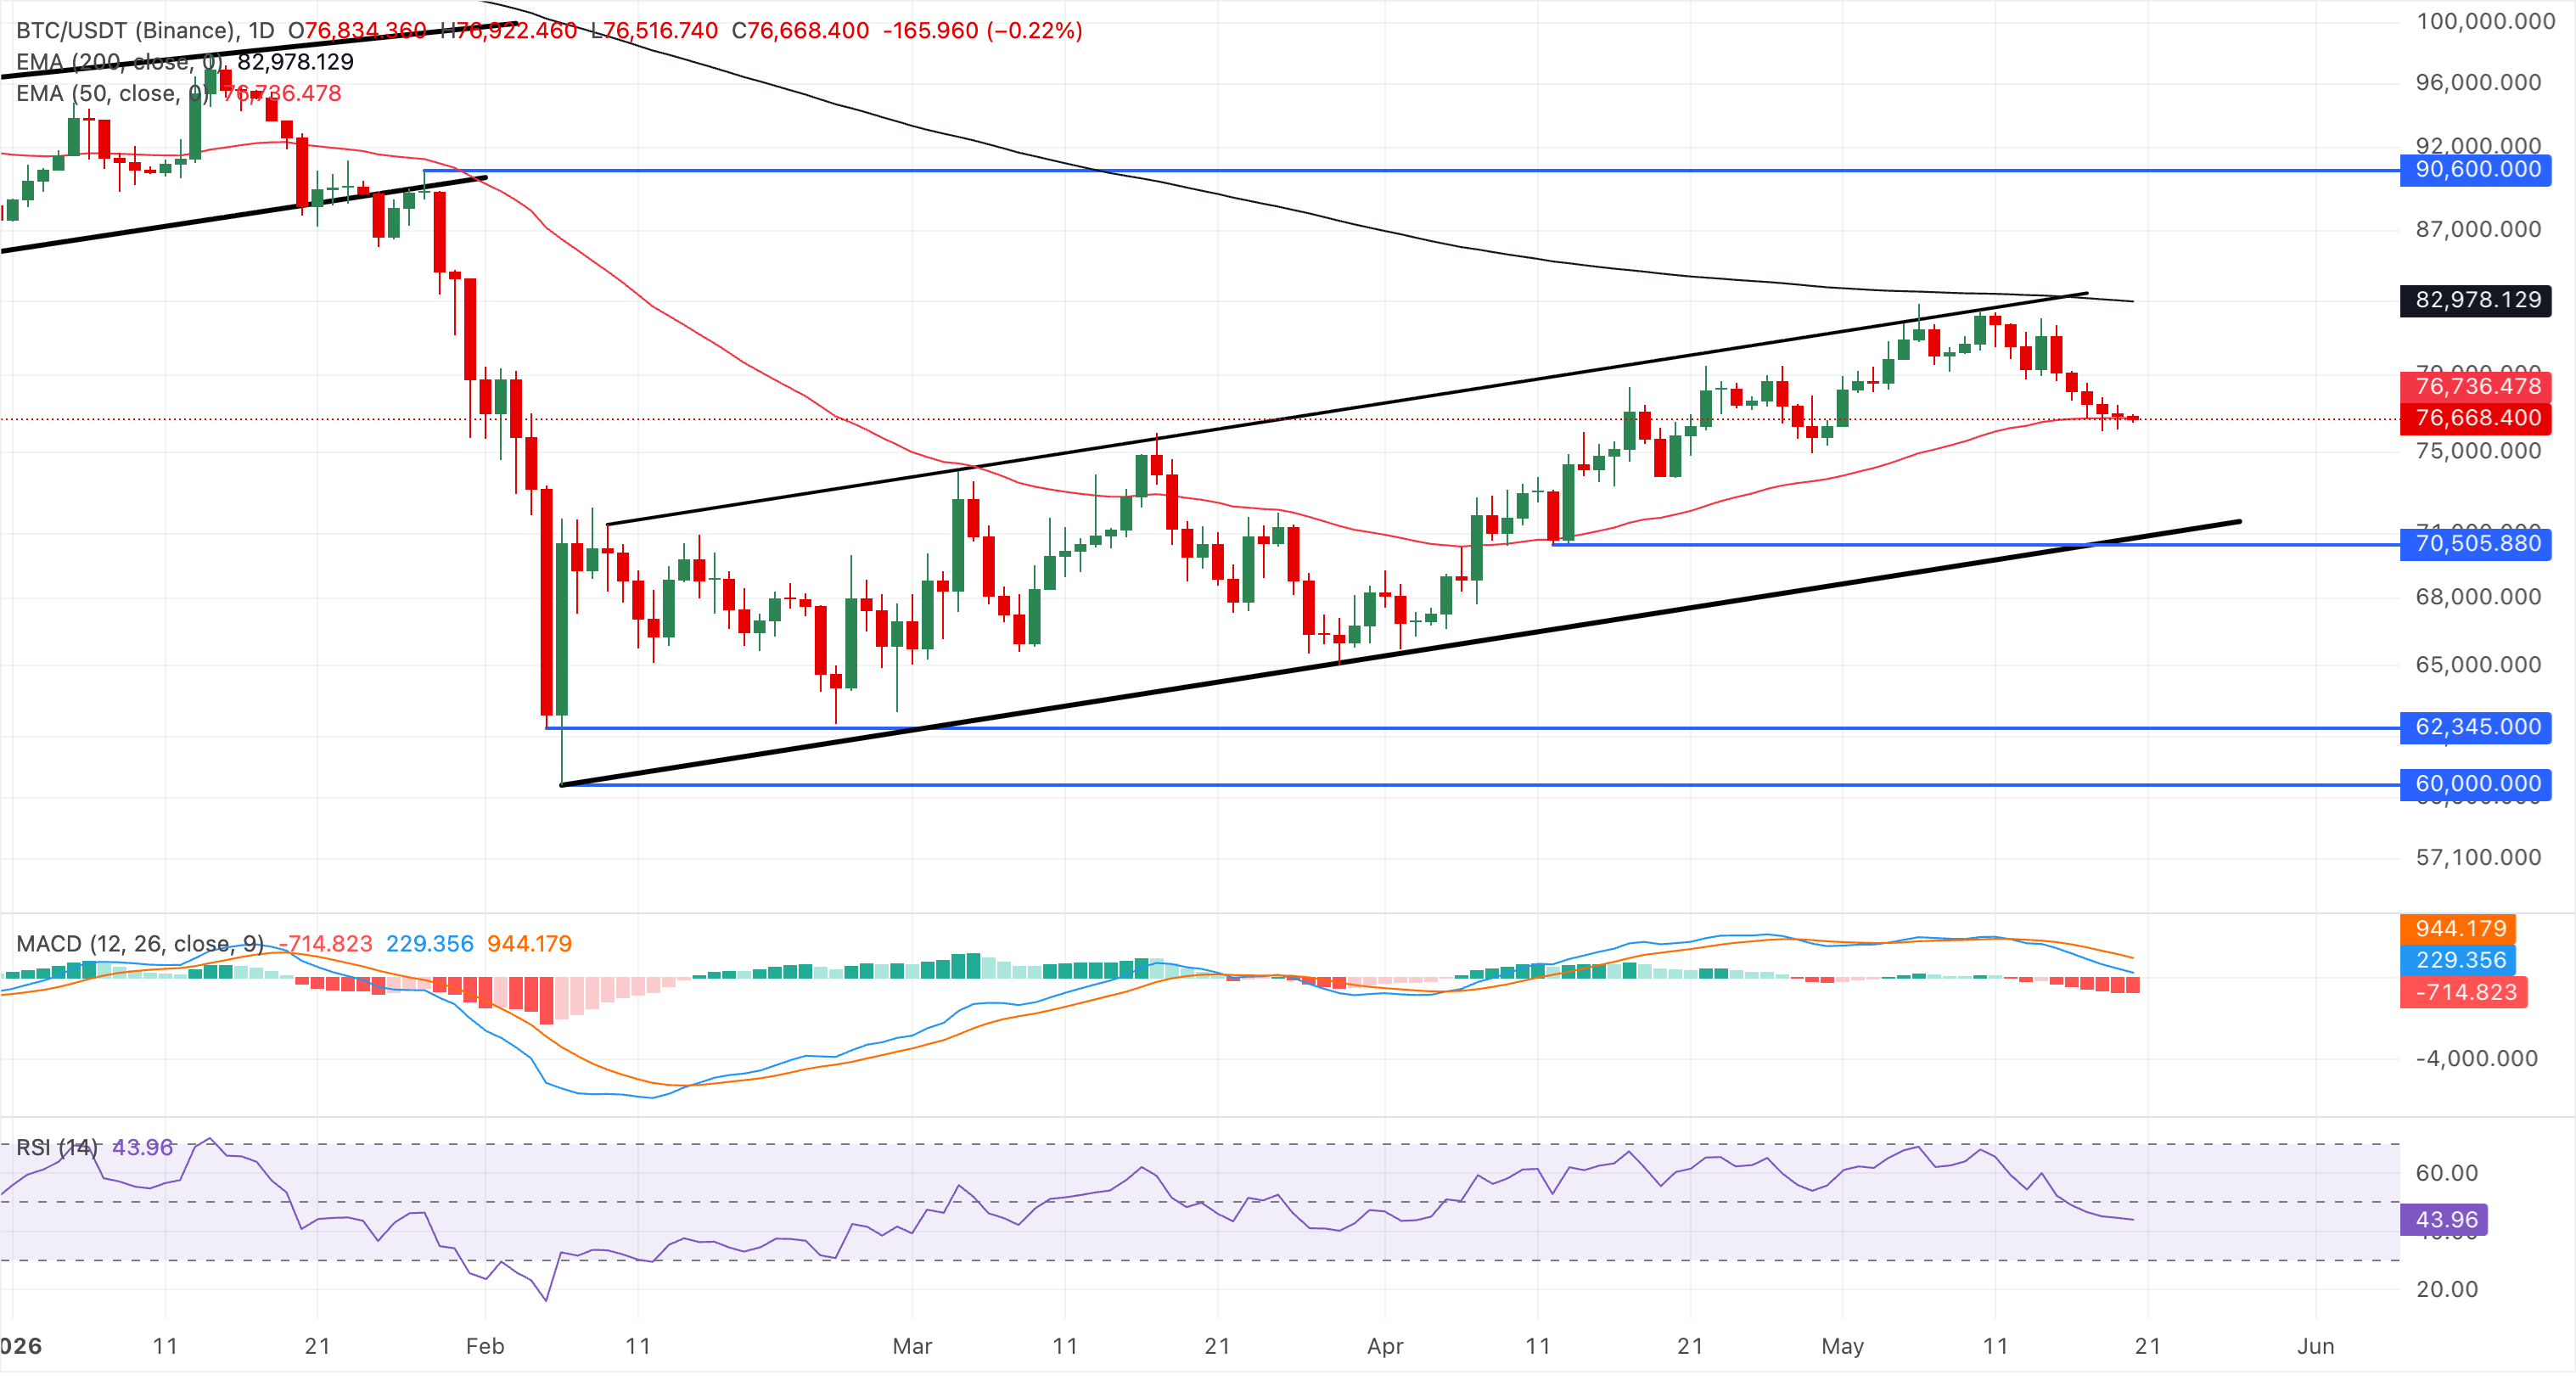
On the topside, immediate resistance is defined by the 50-day EMA at $76,736, with a stronger cap emerging at the 200-day EMA near $82,978. A daily close back above these moving averages would start to ease the current bearish bias and open the door to a more sustained recovery.
Venice Token, Lighter and Algorand extend gains
Venice Token holds well above the 50-day EMA near $11.01 and the 200-day EMA around $6.31, keeping the broader structure firmly bullish, while the reclaimed rising trendline projected toward $11.50 reinforces underlying demand.
Momentum conditions remain supportive, with the RSI hovering in the mid-60s and the MACD line holding modestly above zero, hinting that upside pressure is intact but becoming more measured.
Looking up, the VVV token could test the overhead trendline connecting the March 2 and May 12 highs, near $20. A break above this zone would signal a price surge into discovery mode.
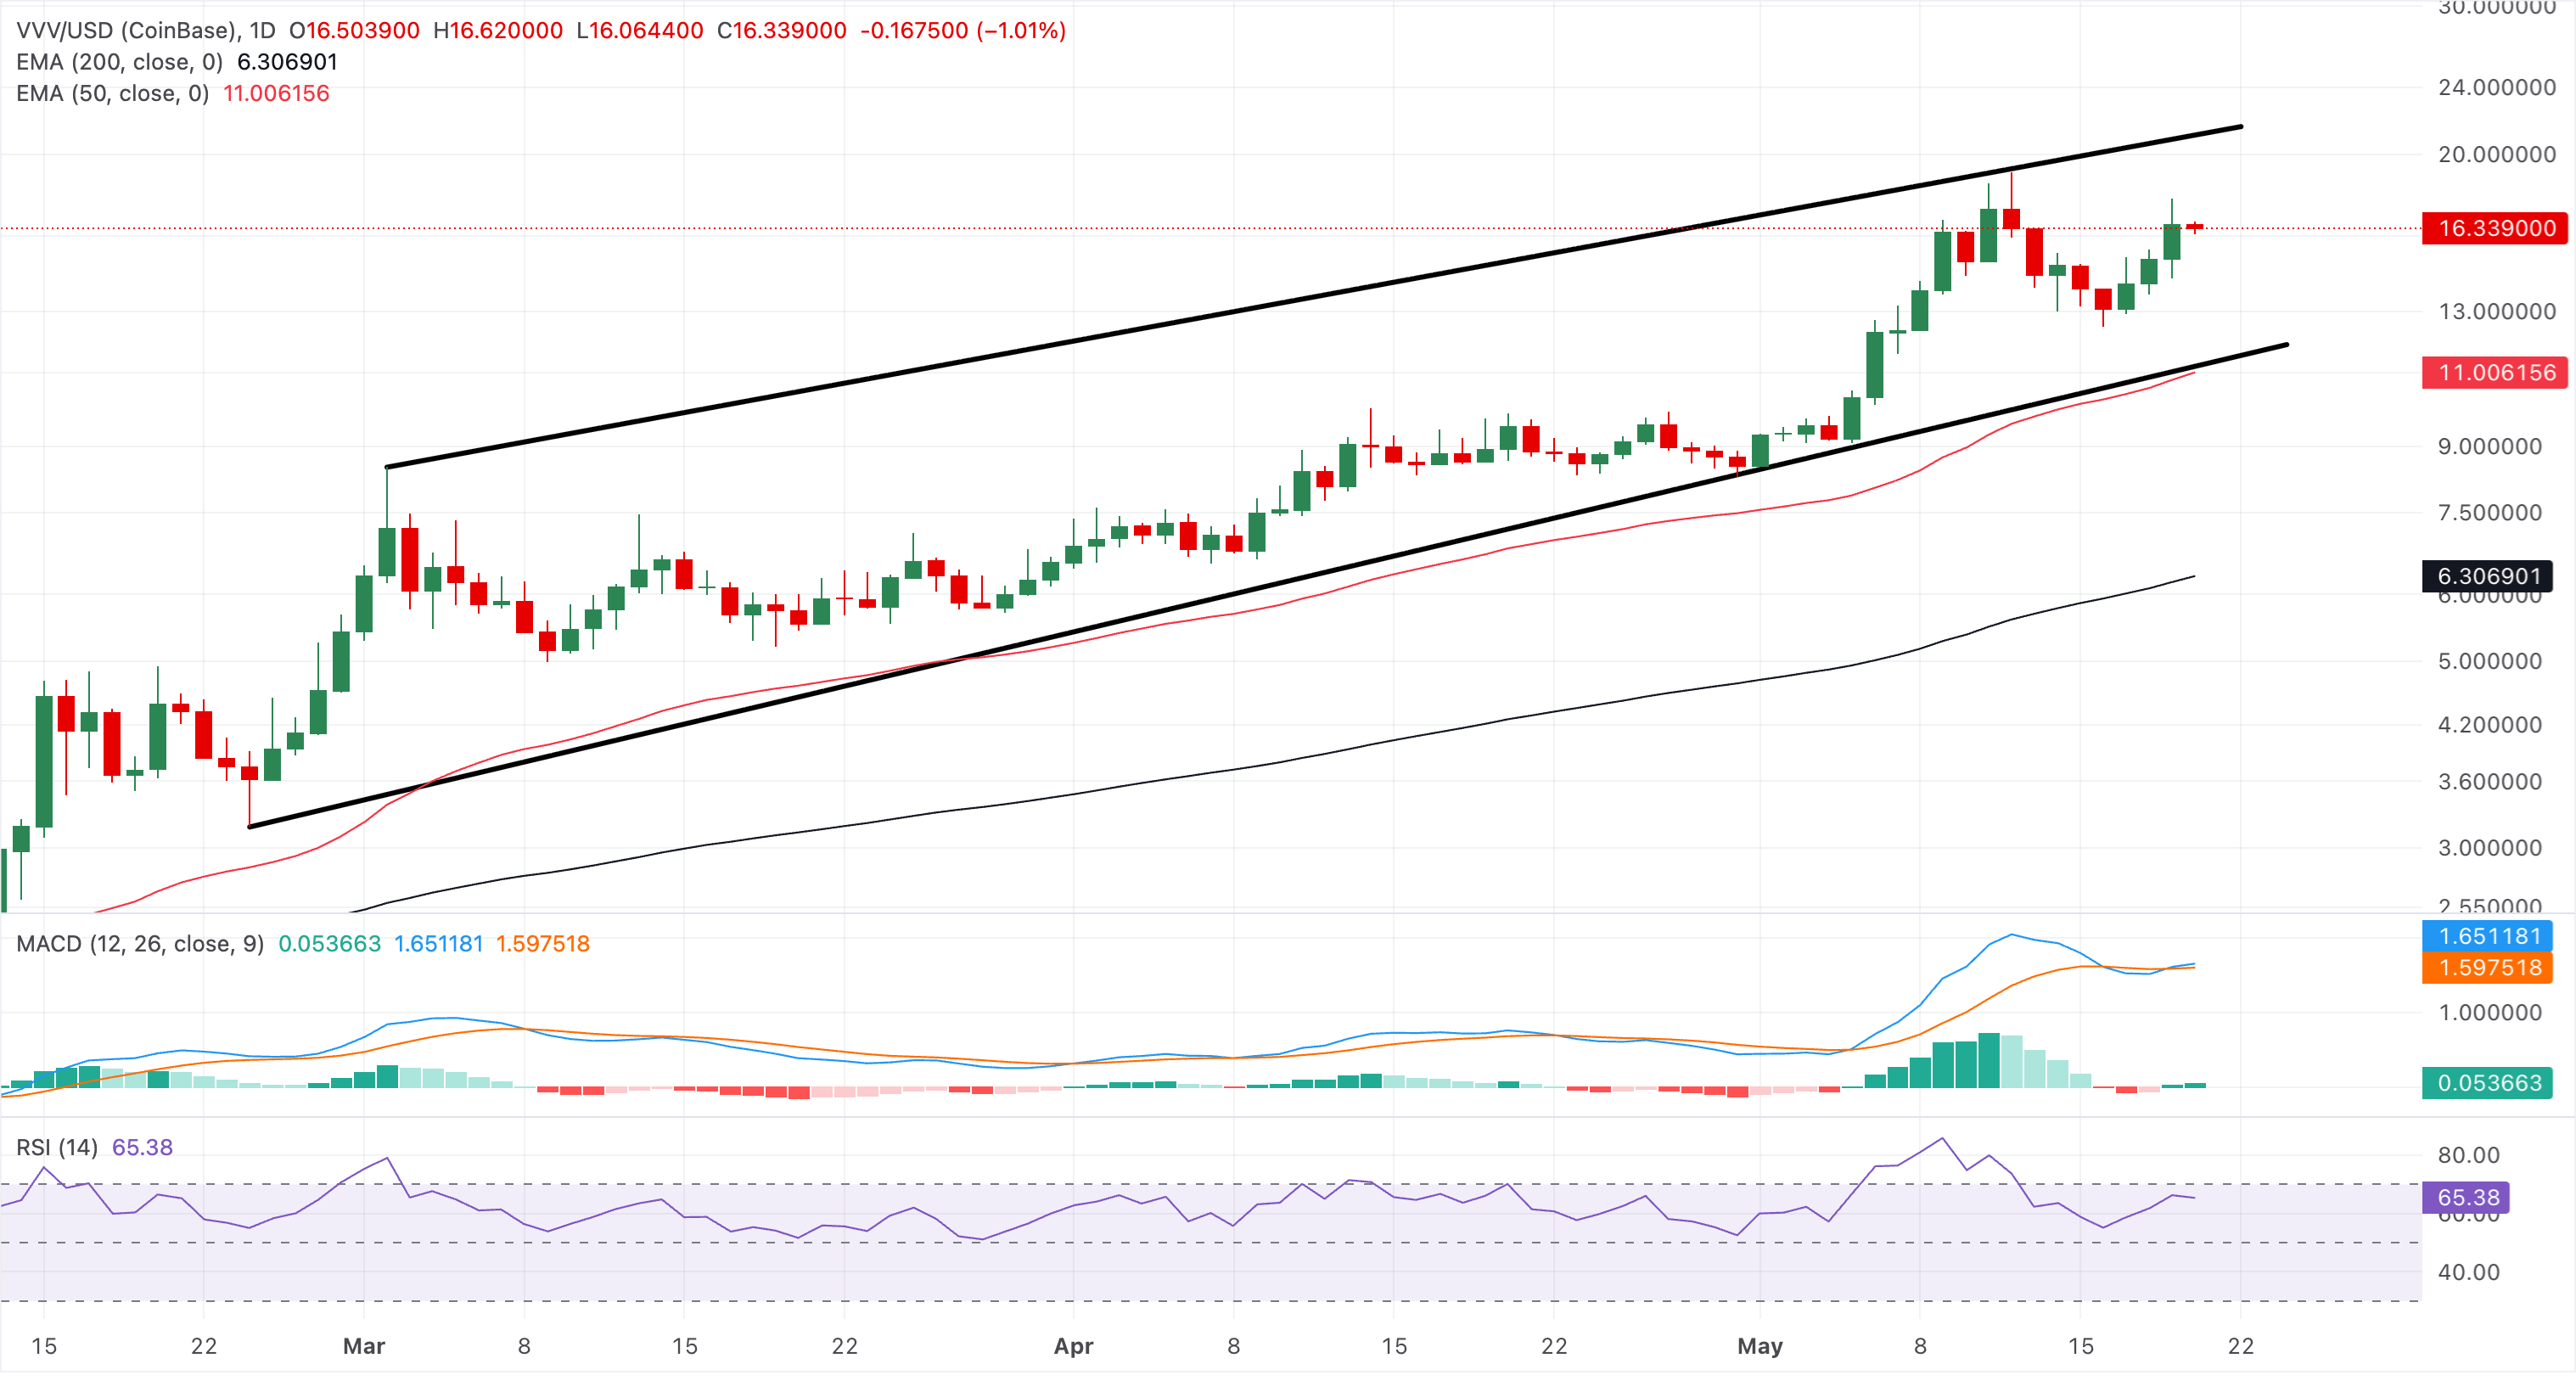
Initial support is seen at the session pivot around $16.34, with a deeper pullback exposing the confluence of the broken but now-supportive uptrend line and the 50-day EMA, clustered just above and below the $11.50–$11.00 area.
Lighter trades above $1.15 at press time on Wednesday, testing the 100-day EMA at $1.16. LIT trades higher for the third consecutive day, and a daily close above $1.16 could test the 78.6% Fibonacci retracement level at $1.20, measured over the downswing from $1.32 to $0.77.
Momentum grows strong to the upside as RSI approaches the overbought zone while MACD and its signal line regain an upward trend, expanding the positive histogram bars.
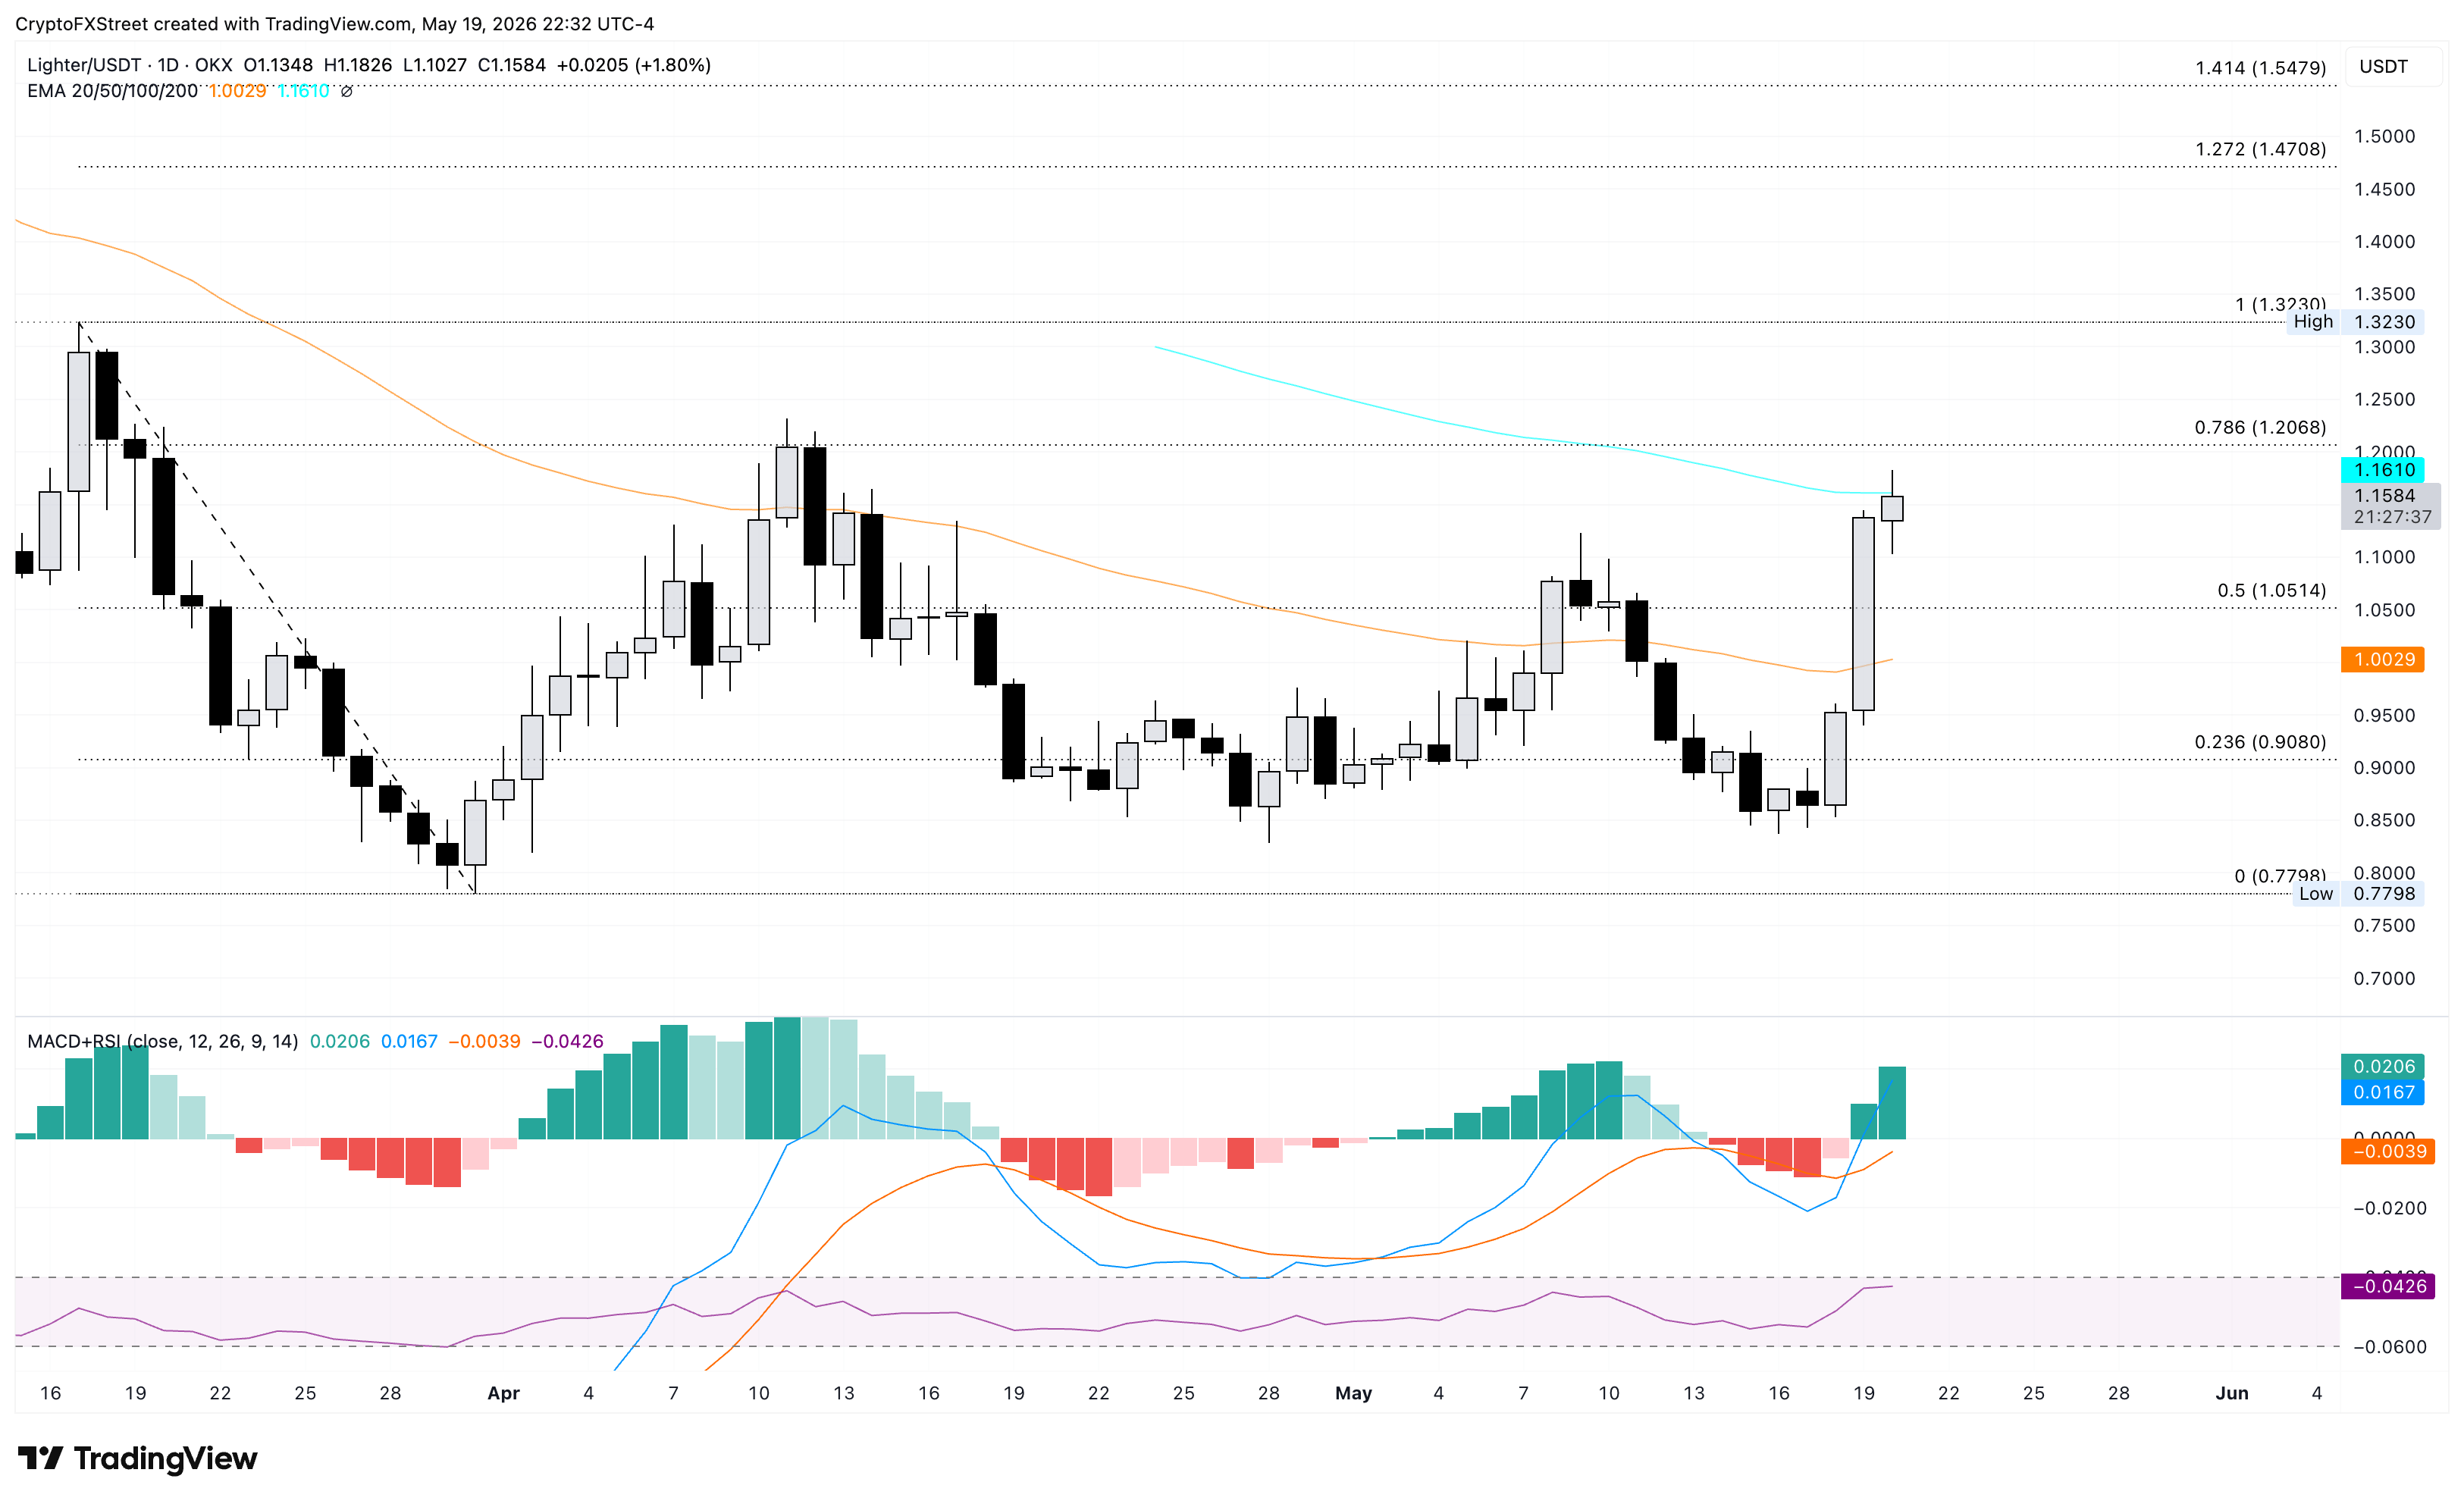
Looking down, the key support remains at the 50% retracement level at $1.05.
Algorand hovers around $0.1165 at the time of writing on Wednesday, holding above the 50-day EMA at roughly $0.1118 but still capped below the 200-day EMA near $0.1243, keeping the broader tone cautiously bearish despite recent stabilization.
Price hovers just under a descending trendline resistance around $0.1186, while the RSI near 52 hints at modestly recovering momentum, and the MACD remains in negative territory with a slightly contracting bearish profile, suggesting downside pressure is easing rather than fully reversing.
Initial resistance lies at the 200-day EMA near $0.1243, where a daily close above would be needed to shift the near-term bias toward a more constructive outlook.
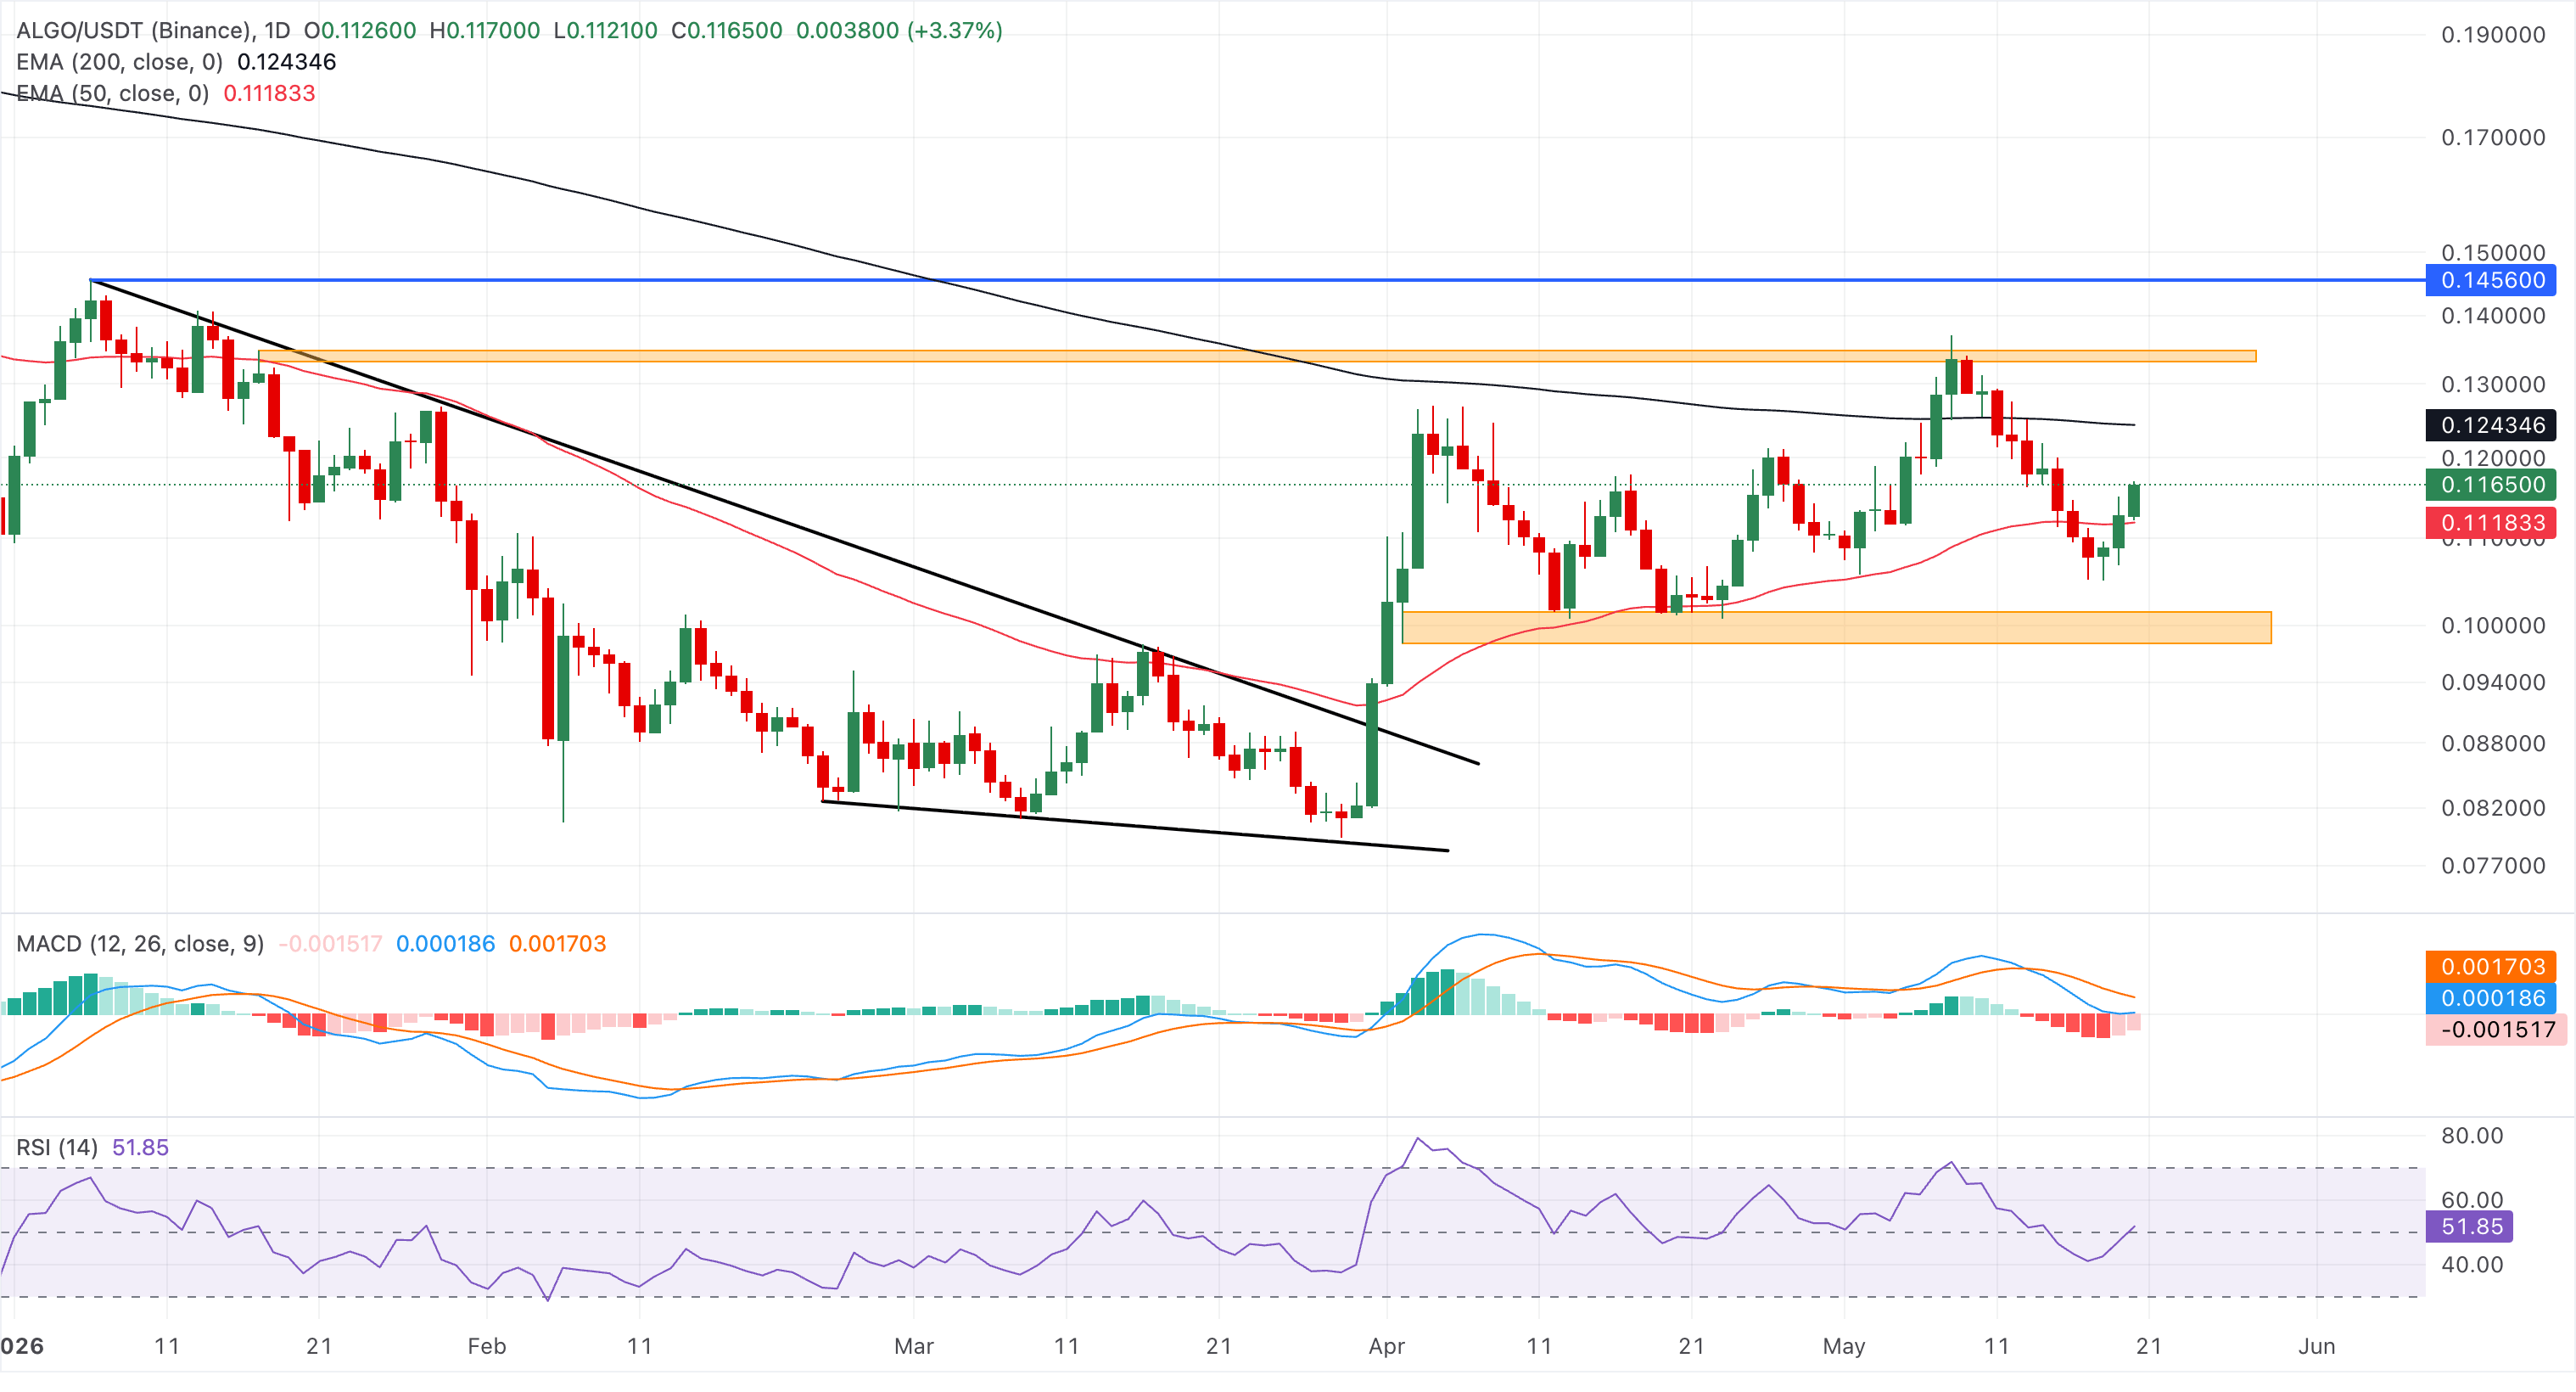
On the flipside, immediate support comes from the 50-day EMA at about $0.1118, and a break below this floor would expose the pair to renewed selling pressure and a potential retest of lower daily swing lows.
(The technical analysis of this story was written with the help of an AI tool.)
Author

Vishal Dixit
FXStreet
Vishal Dixit holds a B.Sc. in Chemistry from Wilson College but found his true calling in the world of crypto.



