Crypto Market Overview: Pi Network, Uniswap lead gains as Bitcoin steadies at $64,000
- Bitcoin holds steady above $64,000 on Thursday, testing its 50-day EMA at $64,660.
- Pi Network emerges as the top performer over the last 24 hours, testing the breakout of a falling channel pattern.
- Uniswap edges higher after a 5% surge the previous day, crossing above its 200-day EMA at $3.8969.

Bitcoin (BTC) trades above $64,000 at press time on Thursday, testing the bullish breakout of its 50-day Exponential Moving Average (EMA) near $64,660. Mild recovery in BTC lifts altcoins, with Pi Network (PI) and Uniswap (UNI) emerging as top performers over the last 24 hours. The technical outlook for the altcoins is bullish, with PI testing the bullish breakout of the falling channel pattern, while UNI extends gains above its 200-day EMA at $3.8969.
Technical outlook: Will BTC price rise above $65,000?
Bitcoin maintains a mildly bullish near-term bias as it tests the 50-day EMA at $64,660 and is well under the 200-day EMA at $73,399. Although BTC remains capped below the short-term EMA, a potential breakout could extend the rally toward the immediate resistance at the June 3 high of $67,516.
The Relative Strength Index (RSI) near 53 rises above the midline with a near-term recovery, while the Moving Average Convergence Divergence (MACD) is on the verge of crossing above its signal line, which together hint at fading downside momentum.
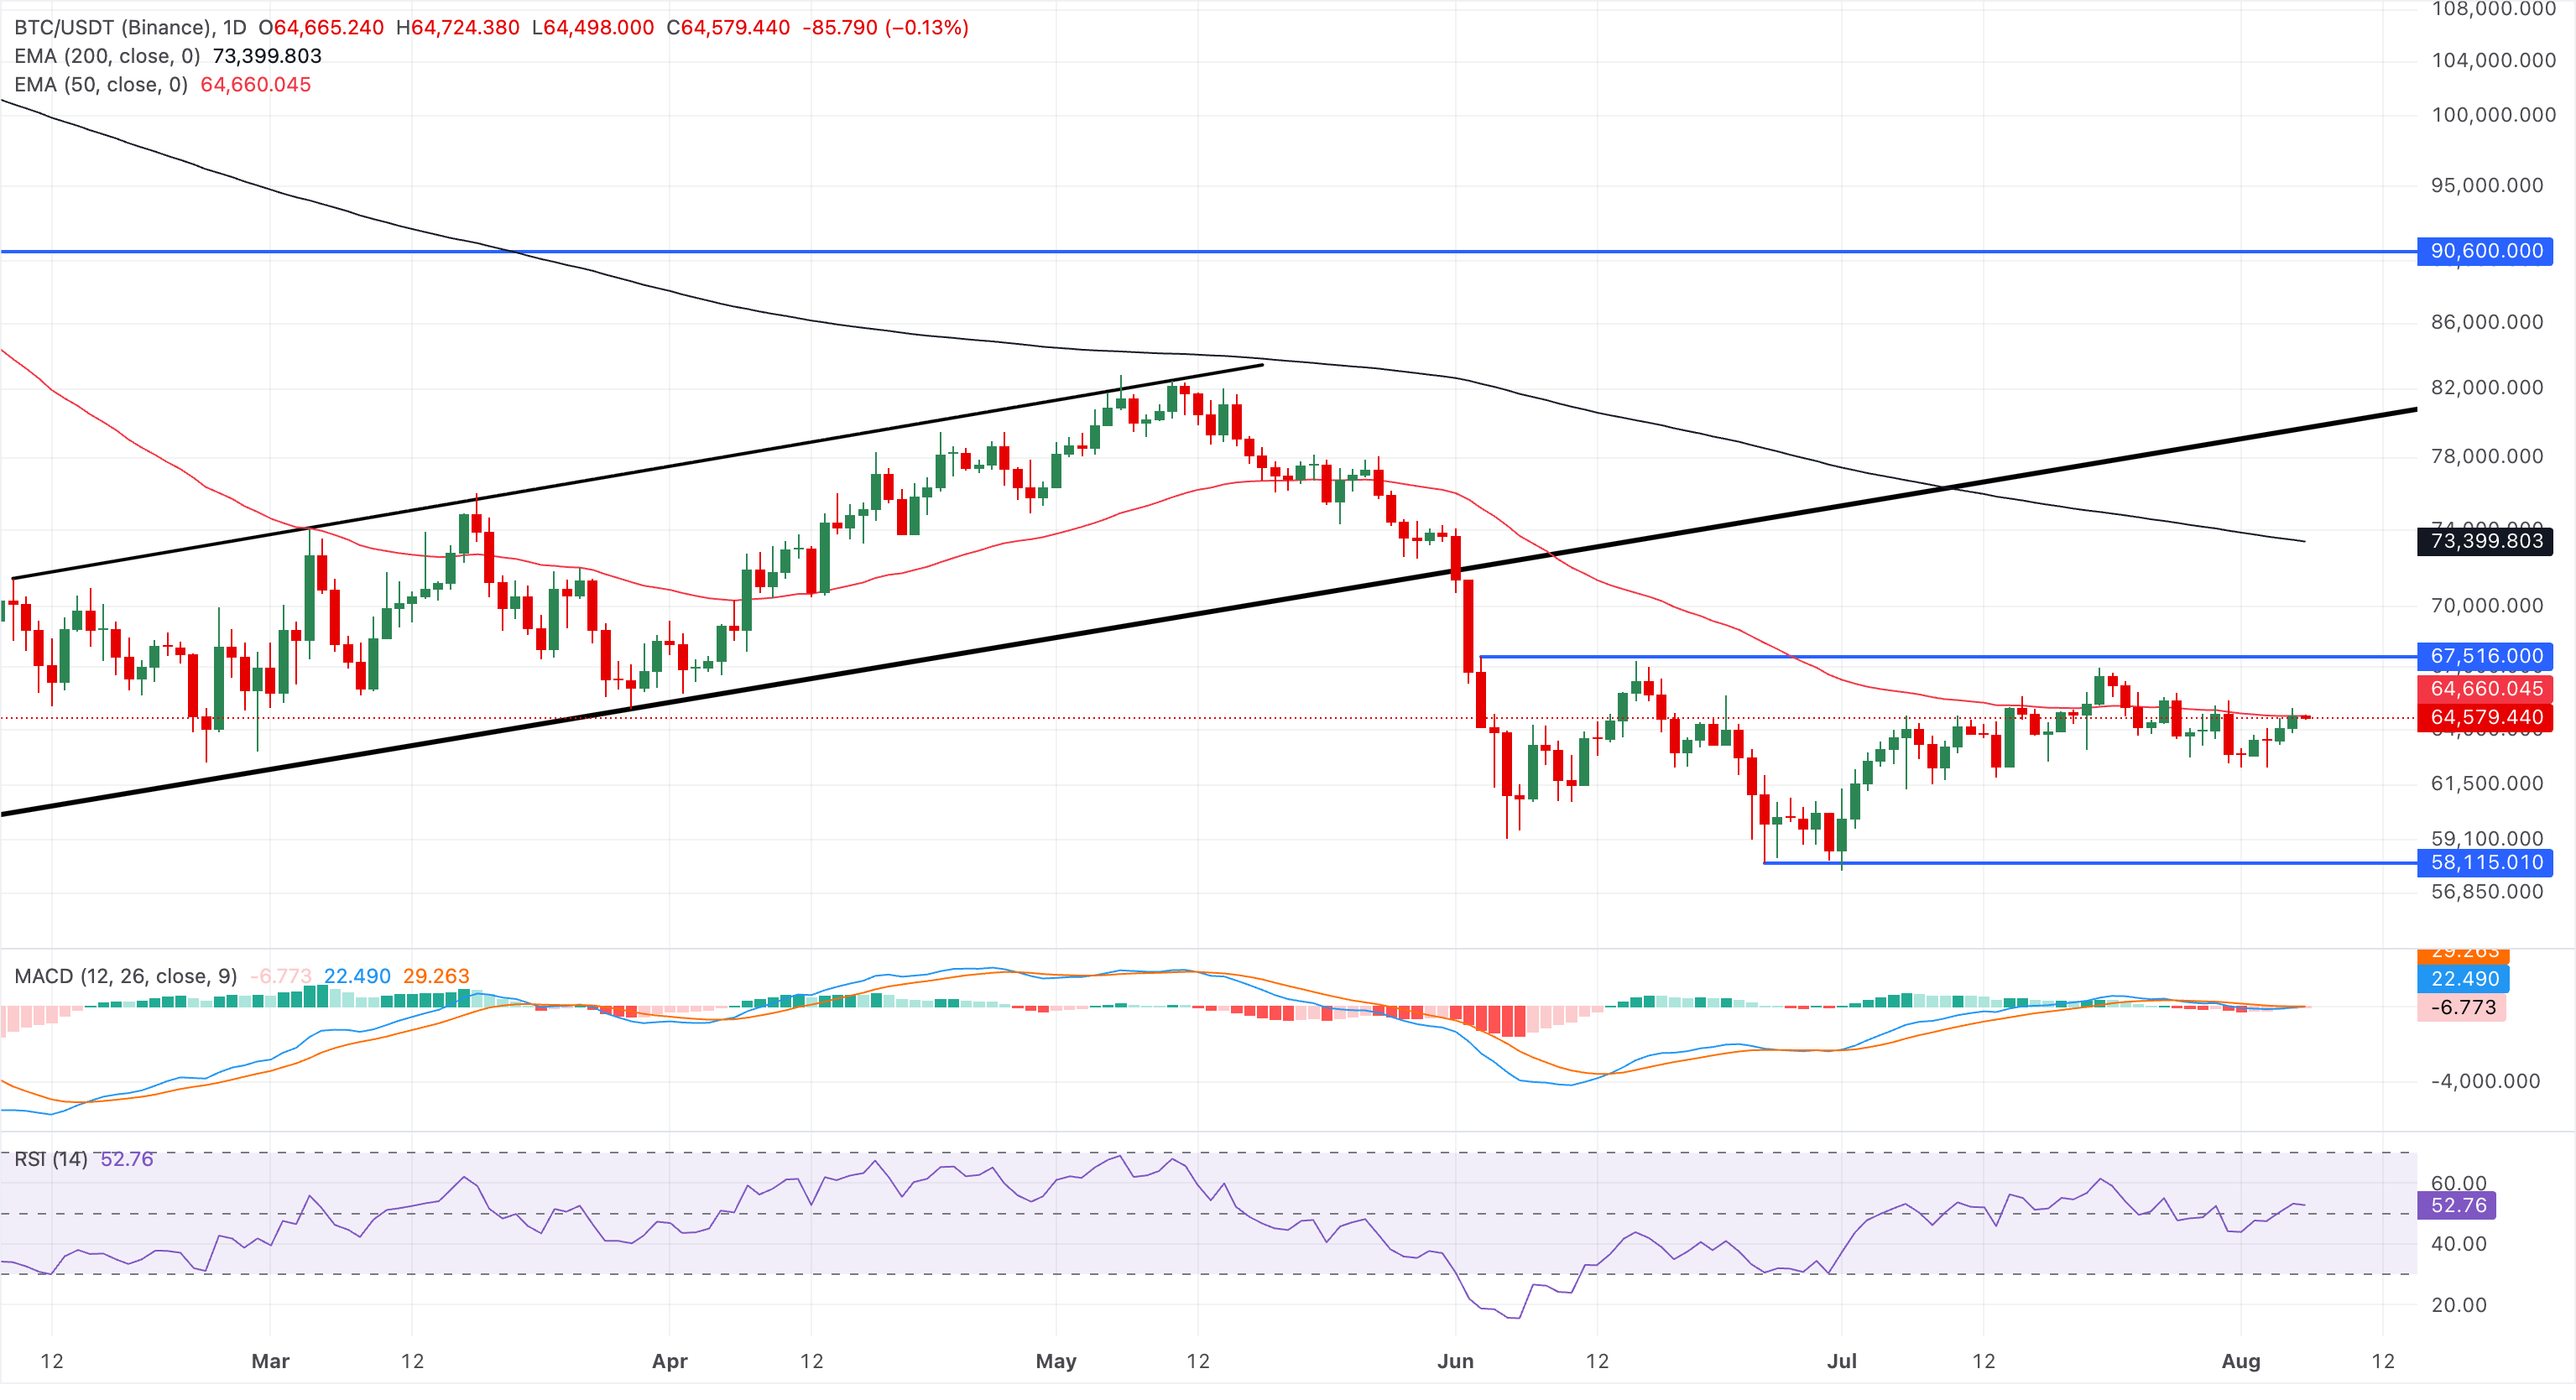
Looking down, the key support for BTC aligns with the $60,000 psychological threshold, reinforced by the swing low near $58,115.
Technical outlook: Could PI and UNI extend gains?
Pi Network shows a mild near-term bullish bias as it tests the bullish breakout of the overhead descending trendline near $0.0900. At the time of writing, PI trades above $0.0900 on Thursday, sustaining the 10% rebound gains from the previous day.
The RSI has recovered toward 55, indicating reduced downside pressure, while the MACD rises with its signal line, hinting that recent buying pressure is attempting to challenge the prevailing downtrend.
Looking up, the initial resistance is seen at the 127.2% Fibonacci extension level of the downswing from the $0.1998 high to the $0.1183 low, at $0.0961, followed by the Fibonacci anchor at $0.1183.
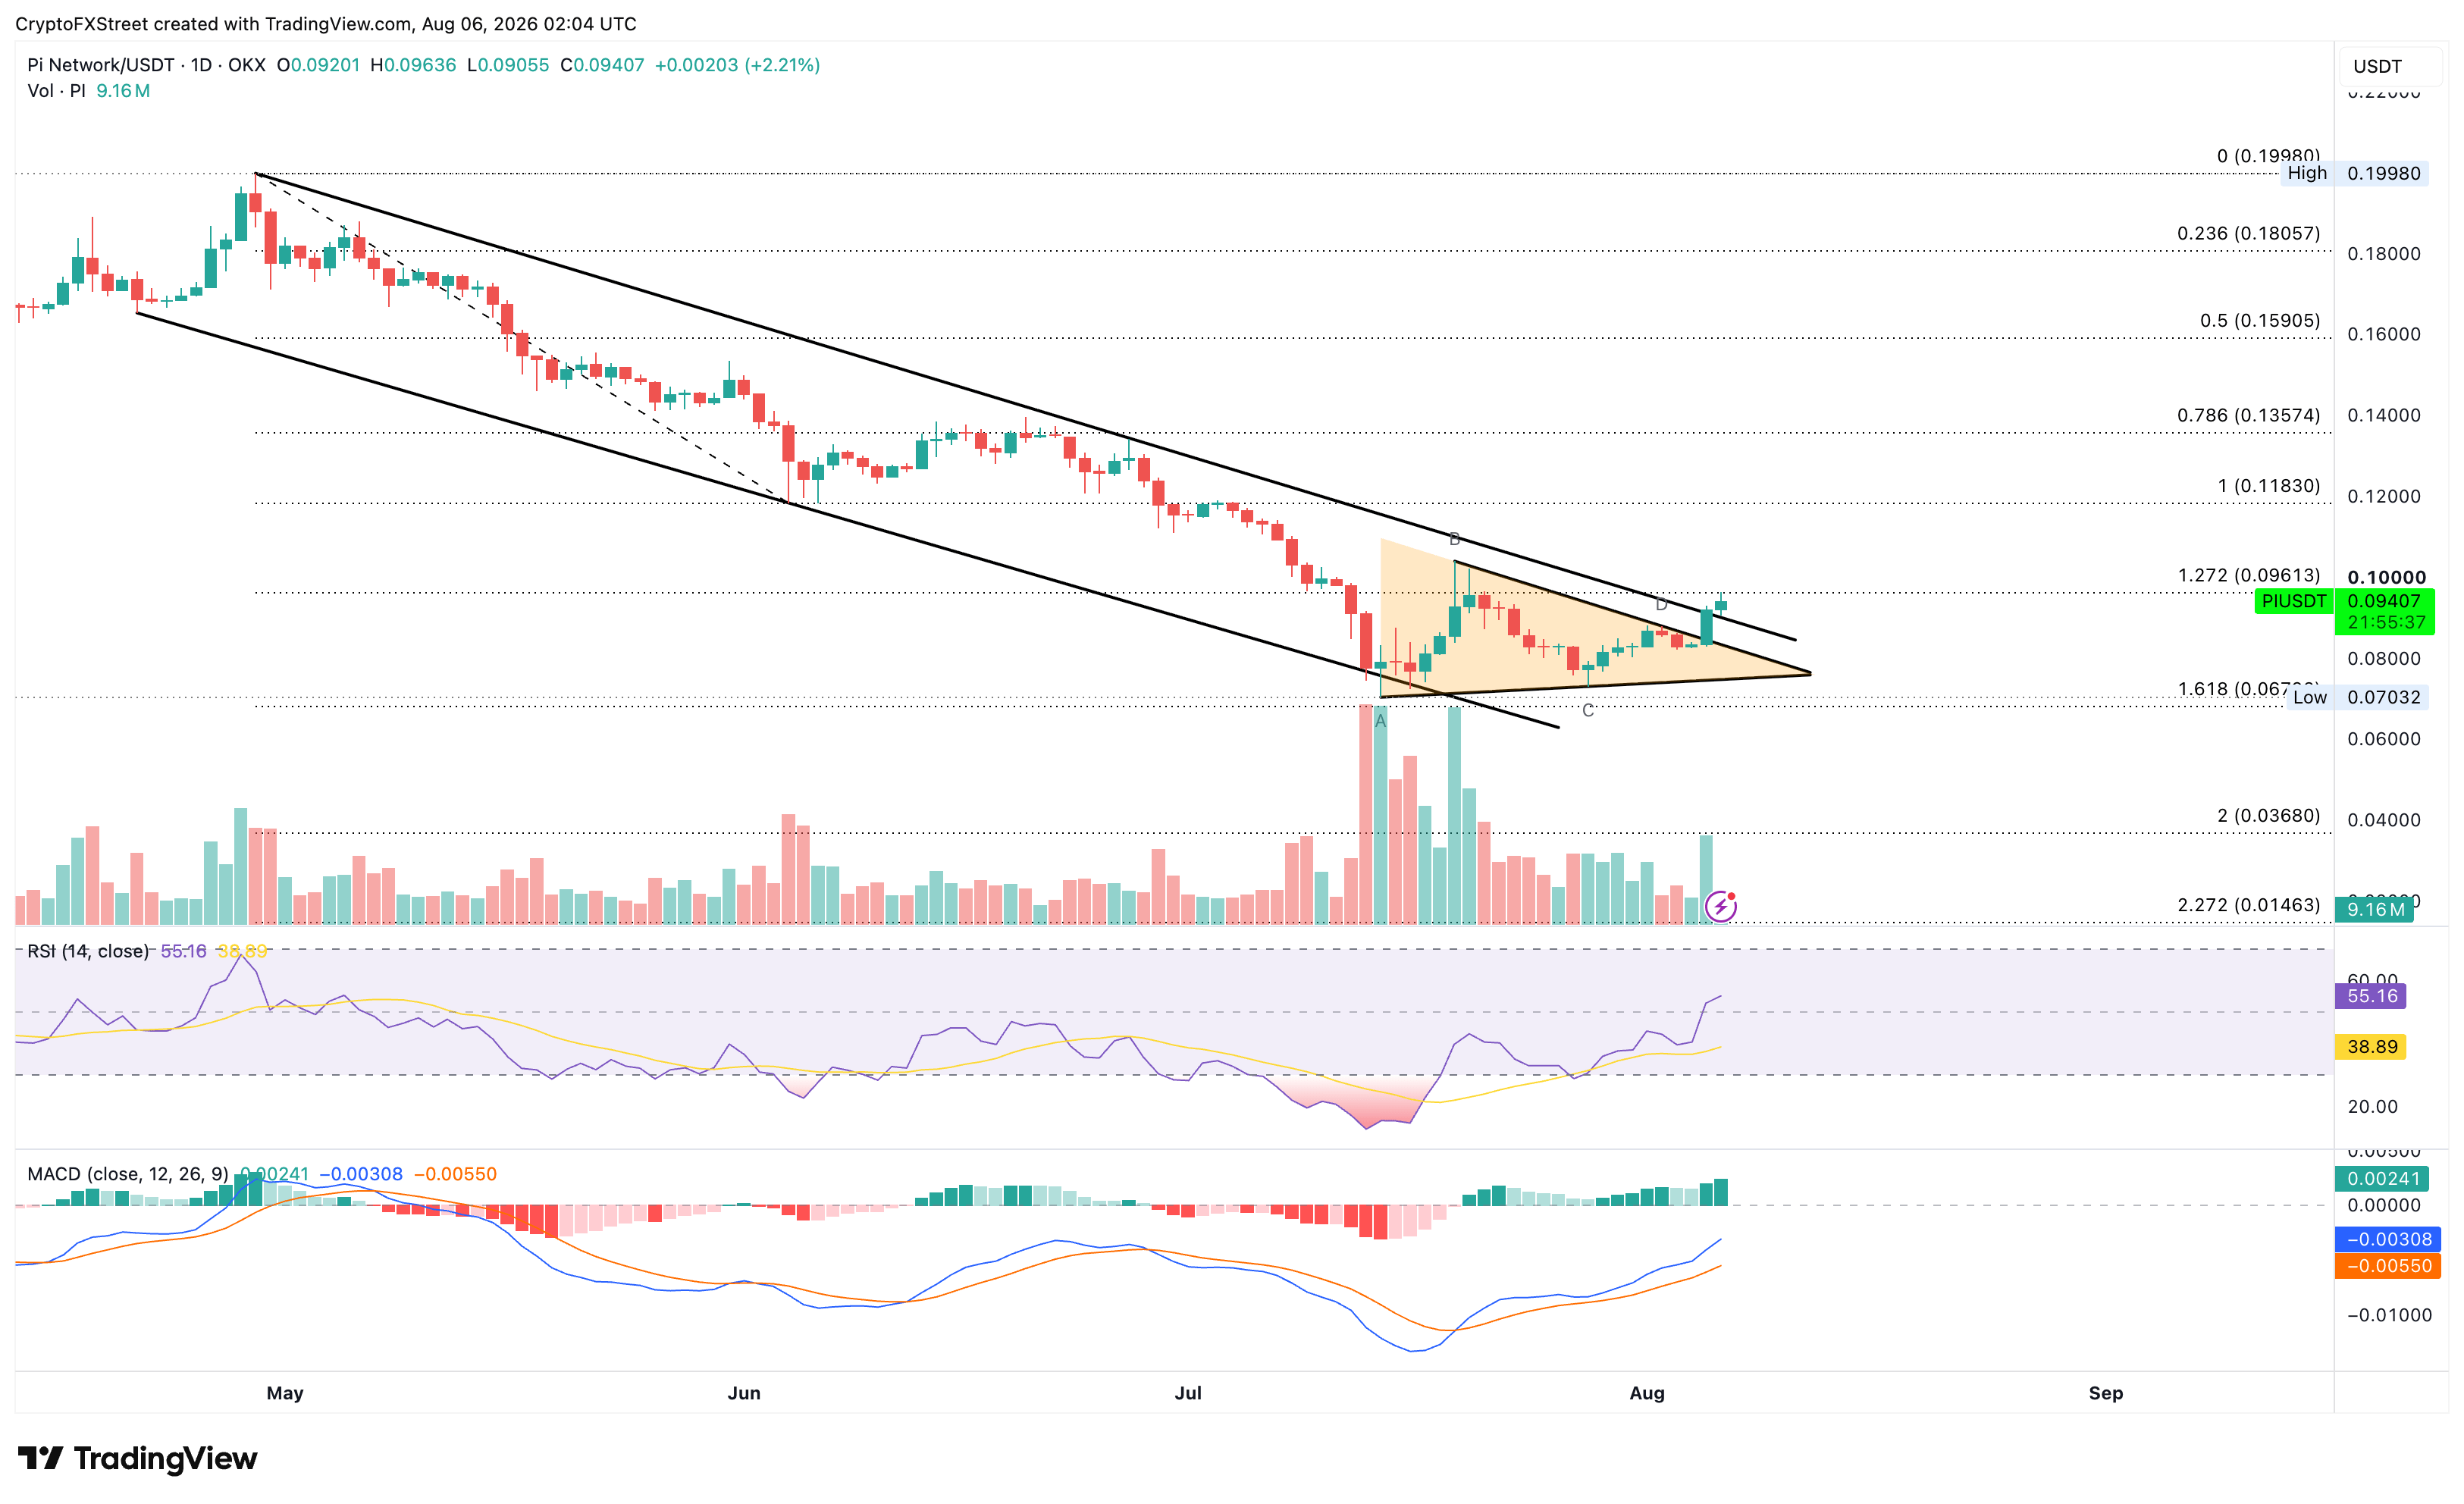
On the downside, a sustained close below $0.0900 would nullify the breakout odds, potentially leading to a decline toward the $0.0700 support level.
Uniswap trades above $4.00 at press time on Thursday, holding a constructive bullish bias as price sits above both the 50-day EMA at $3.6067 and the 200-day EMA at $3.8969. This positioning suggests the broader uptrend remains intact, with bulls eyeing February 11 high at $4.5880, which capped Friday's gains. A decisive close above this level could extend the rally toward the December 21 high near $6.5000.
The MACD crosses below its signal line while RSI holds at 57, hinting at a neutral-to-positive tone rather than signaling overbought conditions.
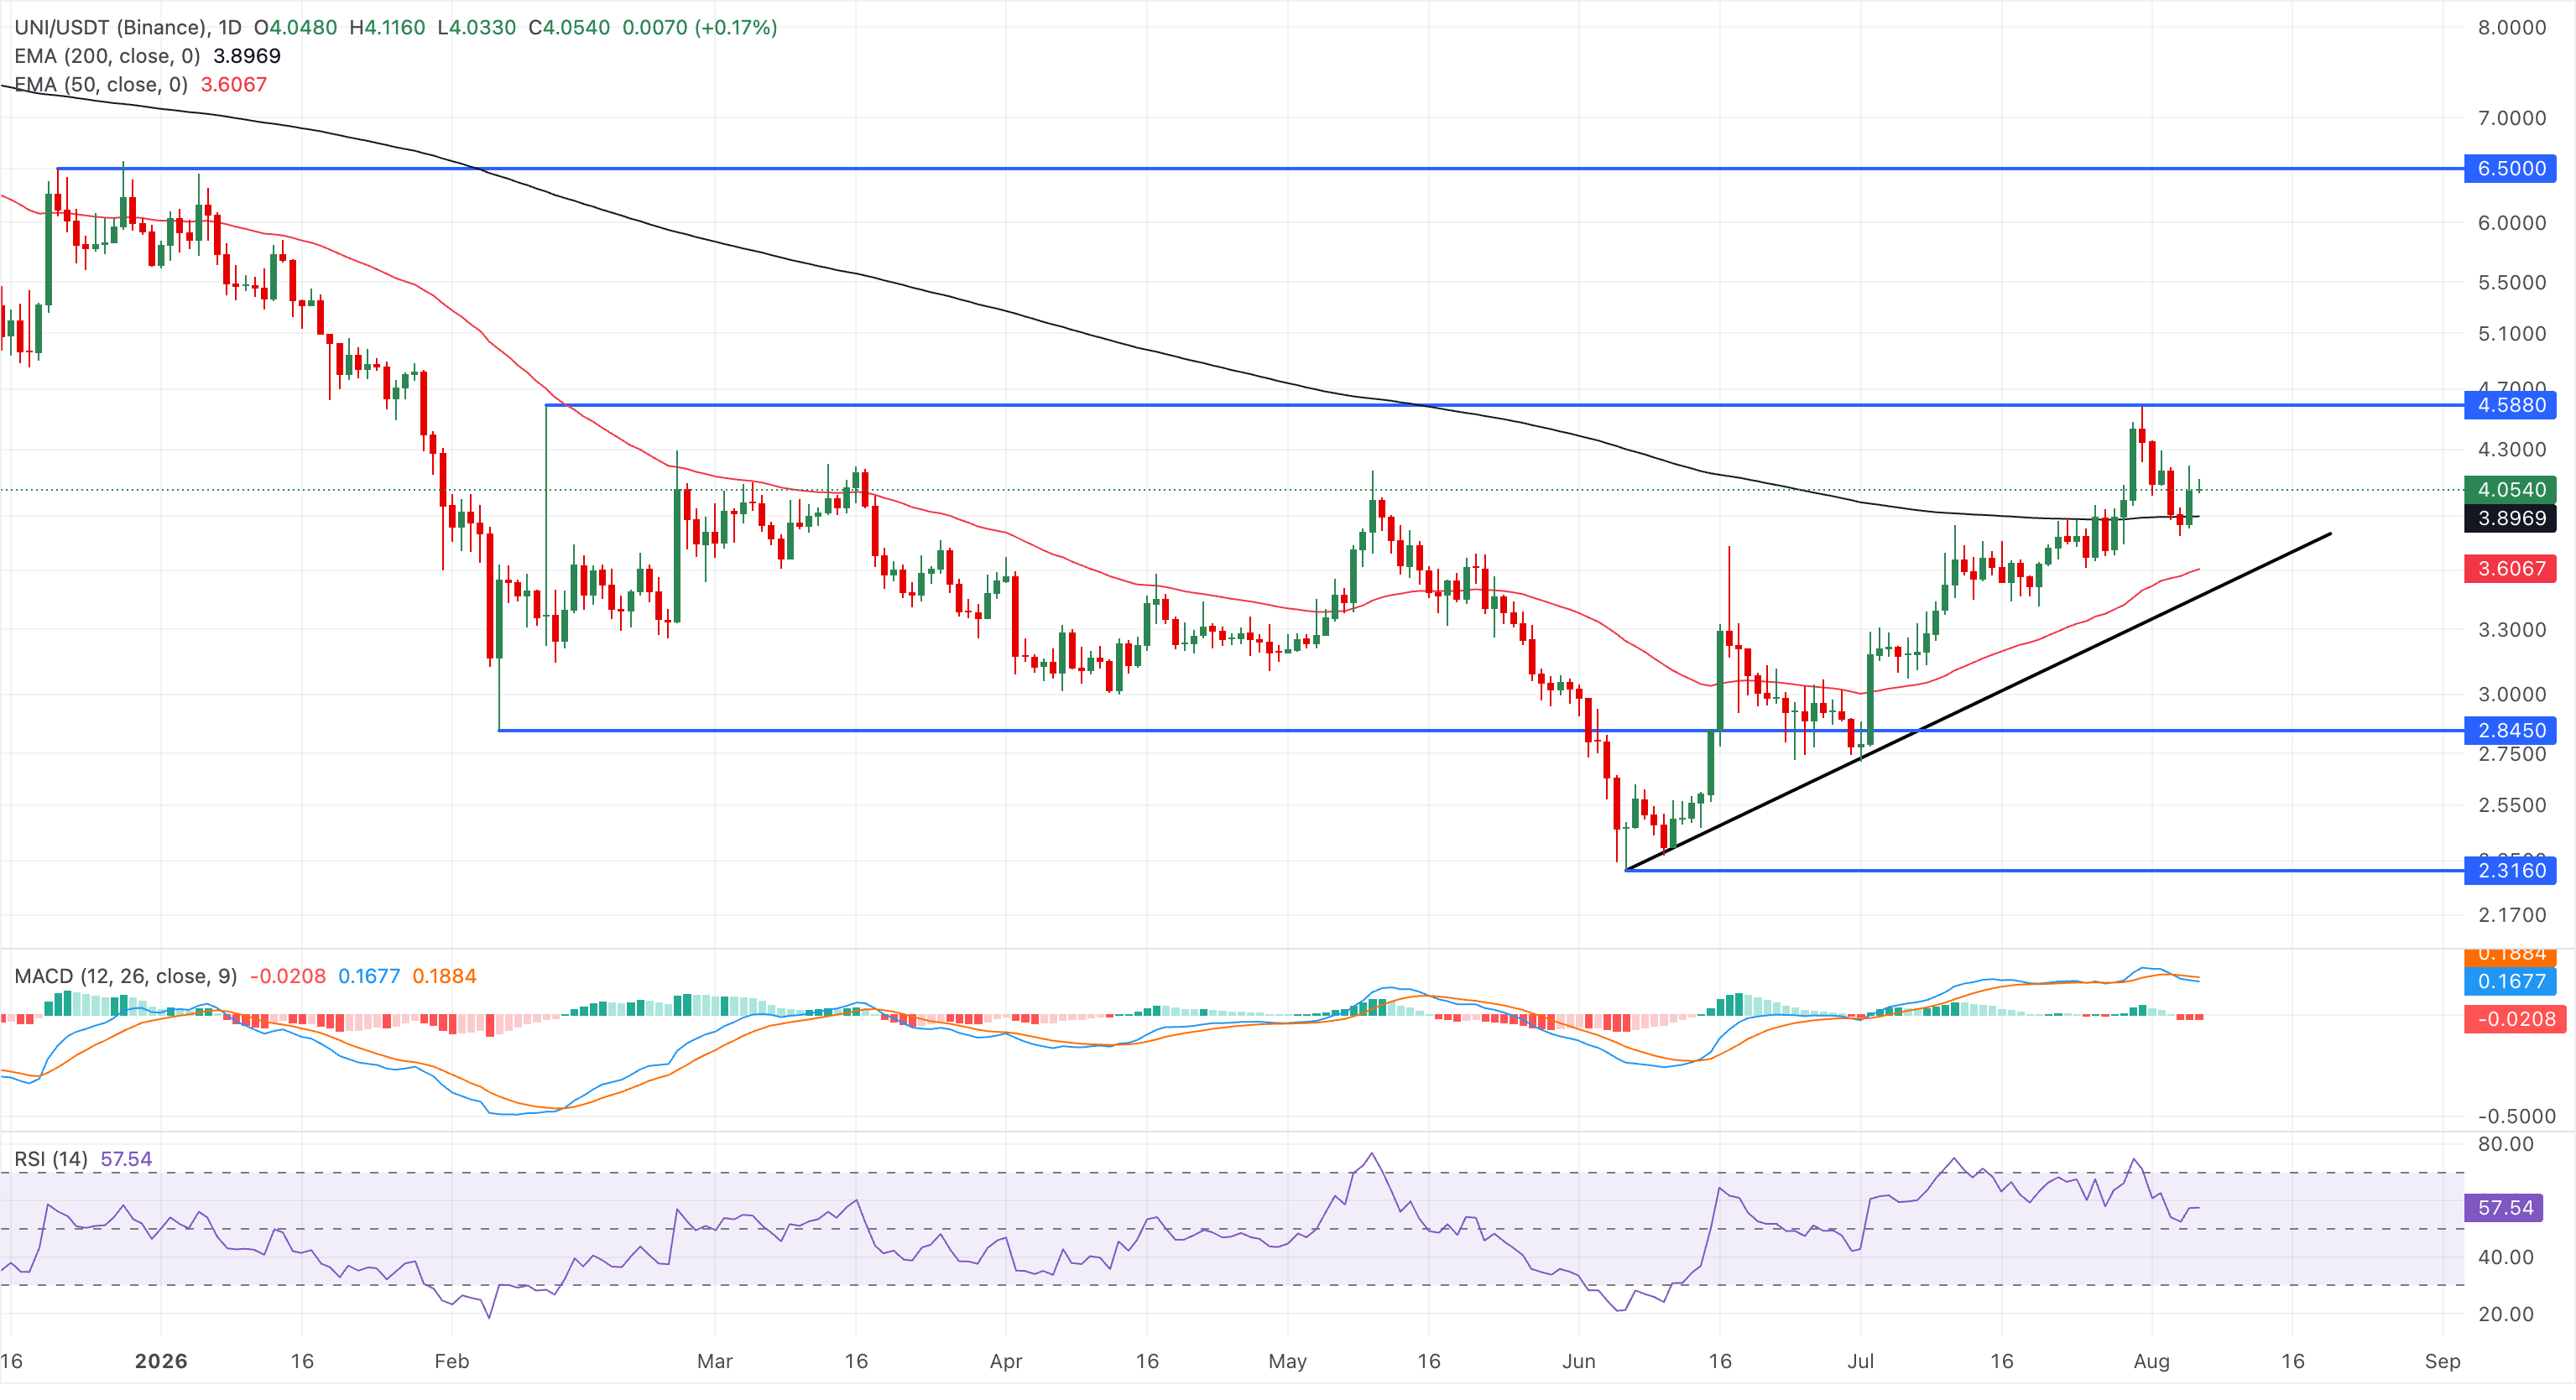
On the downside, initial support is seen at the 200-day EMA near $3.8969, with stronger downside protection emerging at the 50-day EMA around $3.6067.
(The technical analysis of this story was written with the help of an AI tool. Know more.)
Author

Vishal Dixit
FXStreet
Vishal Dixit holds a B.Sc. in Chemistry from Wilson College but found his true calling in the world of crypto.