Crypto Market Overview: Bitcoin loses $69,000 as war escalates – River, Sign, and DeXe rise through
- Bitcoin hovers below $69,000 on Monday, weighing down Ethereum below $2,100 and XRP below $1.40.
- Market sentiment slips into fear amid 24-hour liquidations of over $300 million.
- River, Sign, and DeXe extend recovery amid volatile market conditions.

Bitcoin (BTC) trades below $69,000 at press time on Monday, pulling down Ethereum (ETH) and Ripple (XRP) below $2,100 and $1.40, respectively, as the Middle East war escalates, involving the US, Israel, and Iran. The war is weighing down on the broader cryptocurrency market sentiment, with liquidations of over $300 million in the last 24 hours.
Amid corrective measures across the market, River (RIVER), Sign (SIGN), and DeXe (DEXE) extend gains over the last 24 hours, with bulls aiming to break above key resistances.
Trump’s threat to Iran falters the crypto market’s sentiment as liquidations surge
US President Donald Trump has threatened to bomb Iran’s power plant unless they reopen the Strait of Hormuz, which could stabilize the volatile Oil prices and ease inflation risk across Asia and Europe.
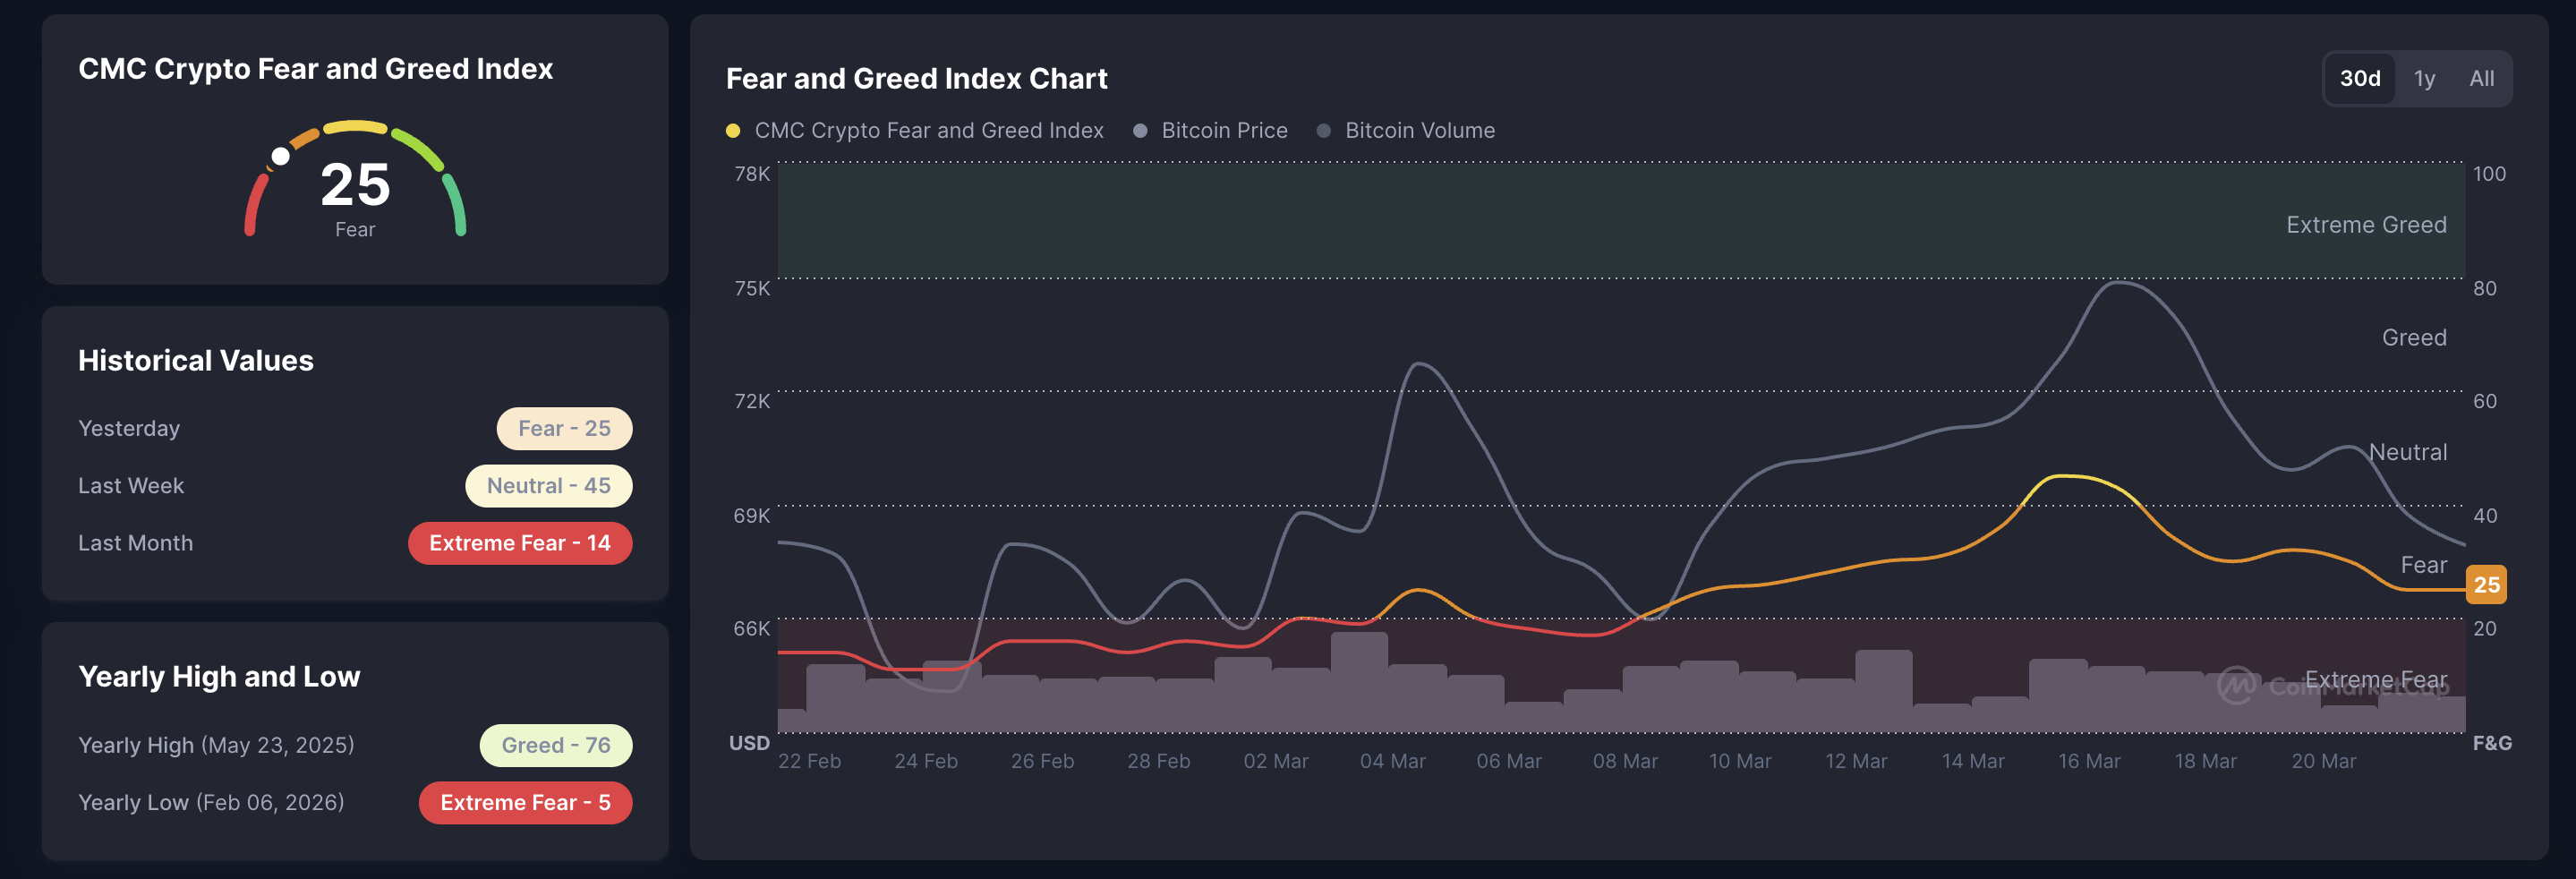
Still, the threat has reinfused fear into the crypto market, leading to forced liquidations. According to CoinMarketCap’s Fear and Greed Index, which stands at 25, suggesting that fear is gripping investor sentiment. If it drops below 20, it would indicate extreme fear in the market, risking a steeper correction in Bitcoin and major altcoins.
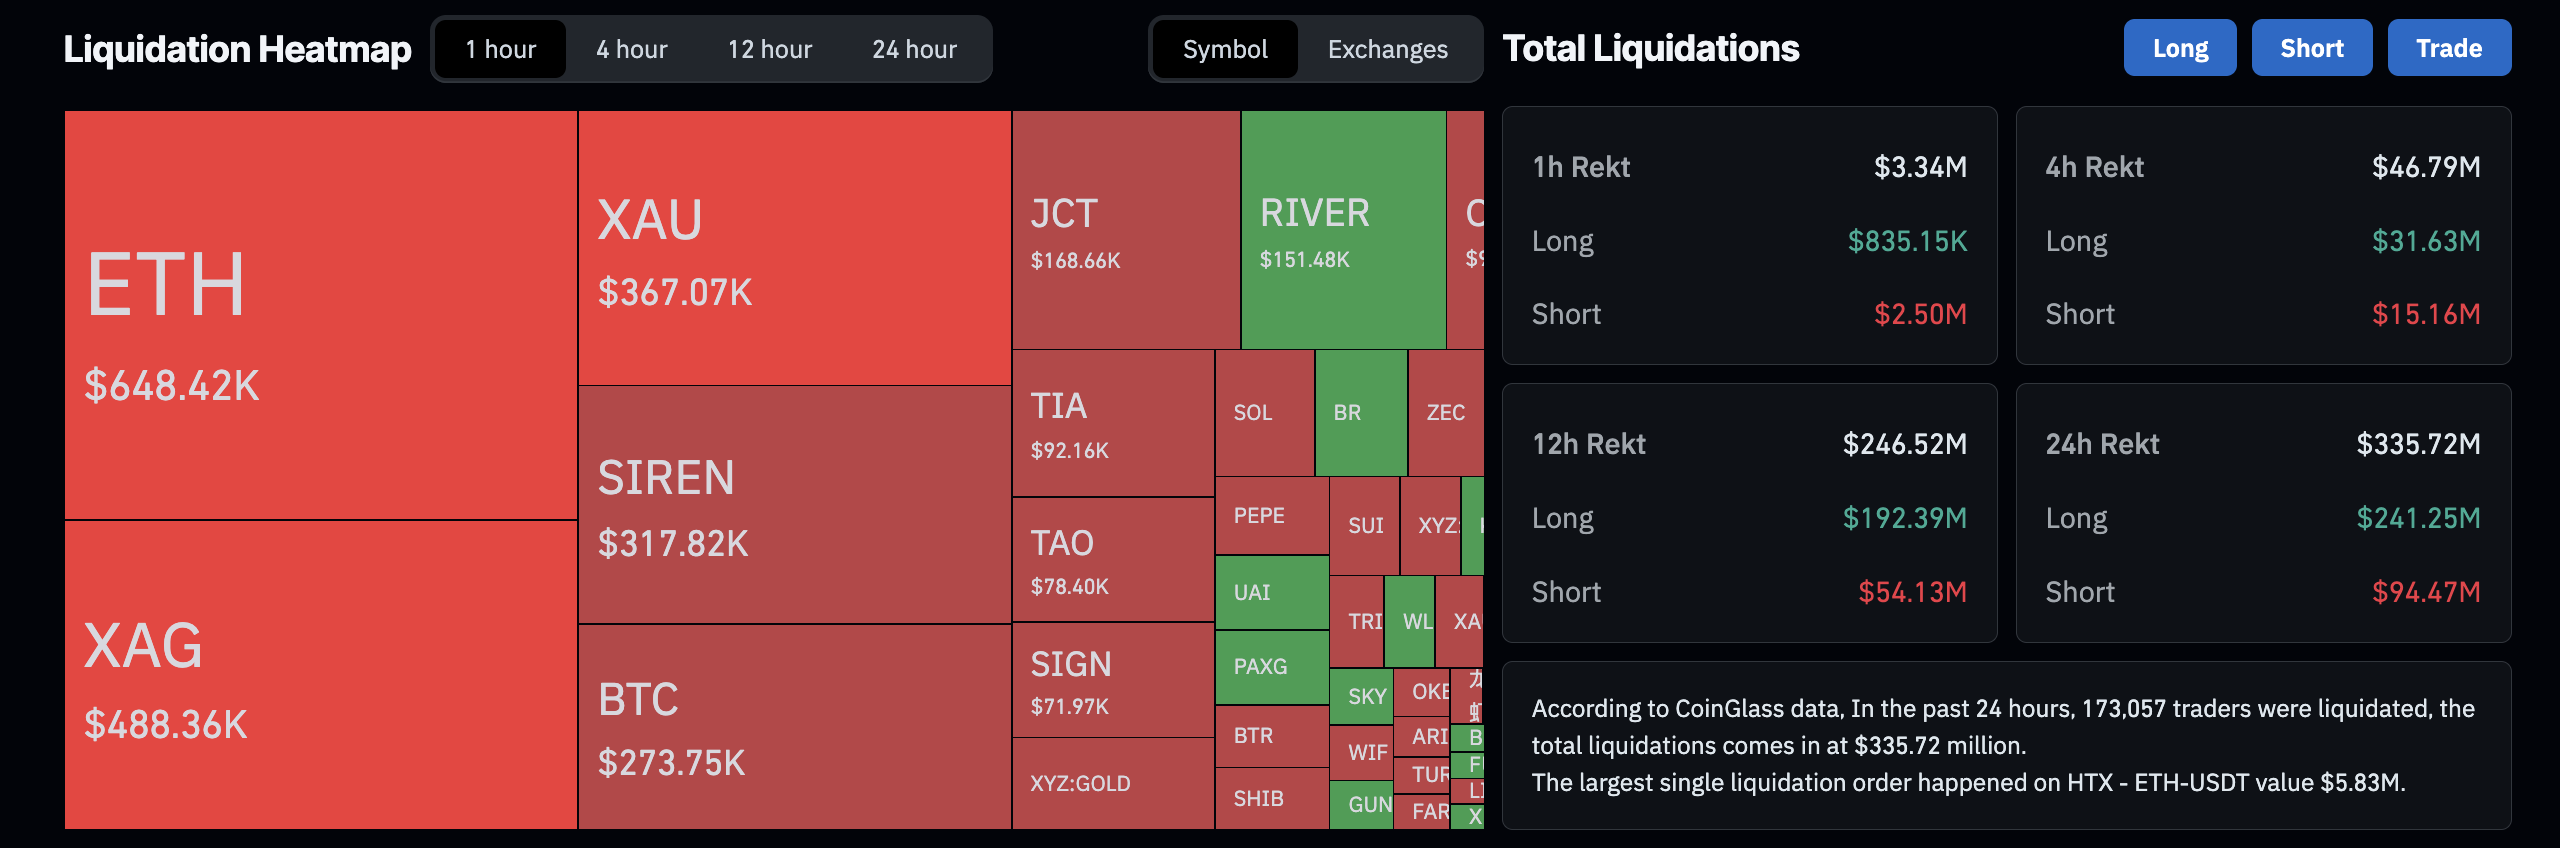
Meanwhile, CoinGlass data shows that the crypto market suffered total liquidations of $335 million over the last 24 hours, led by $241 million in long liquidations, reflecting a bullish wipeout.
Top Crypto Gainers: River, Sign, and DeXe extend gains
River trades near $30 at press time on Monday, holding the 15% gains from the previous day. The near-term bias is mildly bullish, as price holds well above the 50- and 100-day Exponential Moving Averages (EMAs) at $19.20 and $17.24, respectively, keeping the broader uptrend intact despite recent volatility.
RIVER holds above the 50% retracement level at $25.22, measured from $87.60 to $7.26, which has now been broken and turns into nearby support, underpinning the latest breakout. As long as RIVER holds above $25.22, focus stays on the next Fibonacci resistance level at the 78.6% retracement at $51.41.
The Moving Average Convergence Divergence (MACD) line remains above its signal line and in positive territory, while the histogram stays positive, suggesting sustained upside momentum rather than a topping pattern. The Relative Strength Index (RSI) at 67 is close to overbought but not extreme, suggesting strong buying pressure and scope for further gains before a deeper correction.
On the downside, initial support is seen at $25.22, followed by the rising 50-day EMA at $19.20, where a deeper pullback would be expected to attract dip buyers and protect the broader bullish tone.
At the same time, DeXe is trading above $7 on Monday, sustaining its 37% gains from the previous week. The near-term bias is bullish as DEXE extends above the 200-day EMA while the 50-day and 100-day EMAs mark a Golden Cross.
The MACD line remains above its signal line and the zero line, with a positive histogram suggesting strengthening upside momentum. The RSI at 85 signals overbought conditions, suggesting stretched upside and a growing risk of a corrective pause, even as buyers retain control.
Immediate resistance is aligned with the 78.6% Fibonacci retracement at $8.75, measured from $16.63 to $1.72.
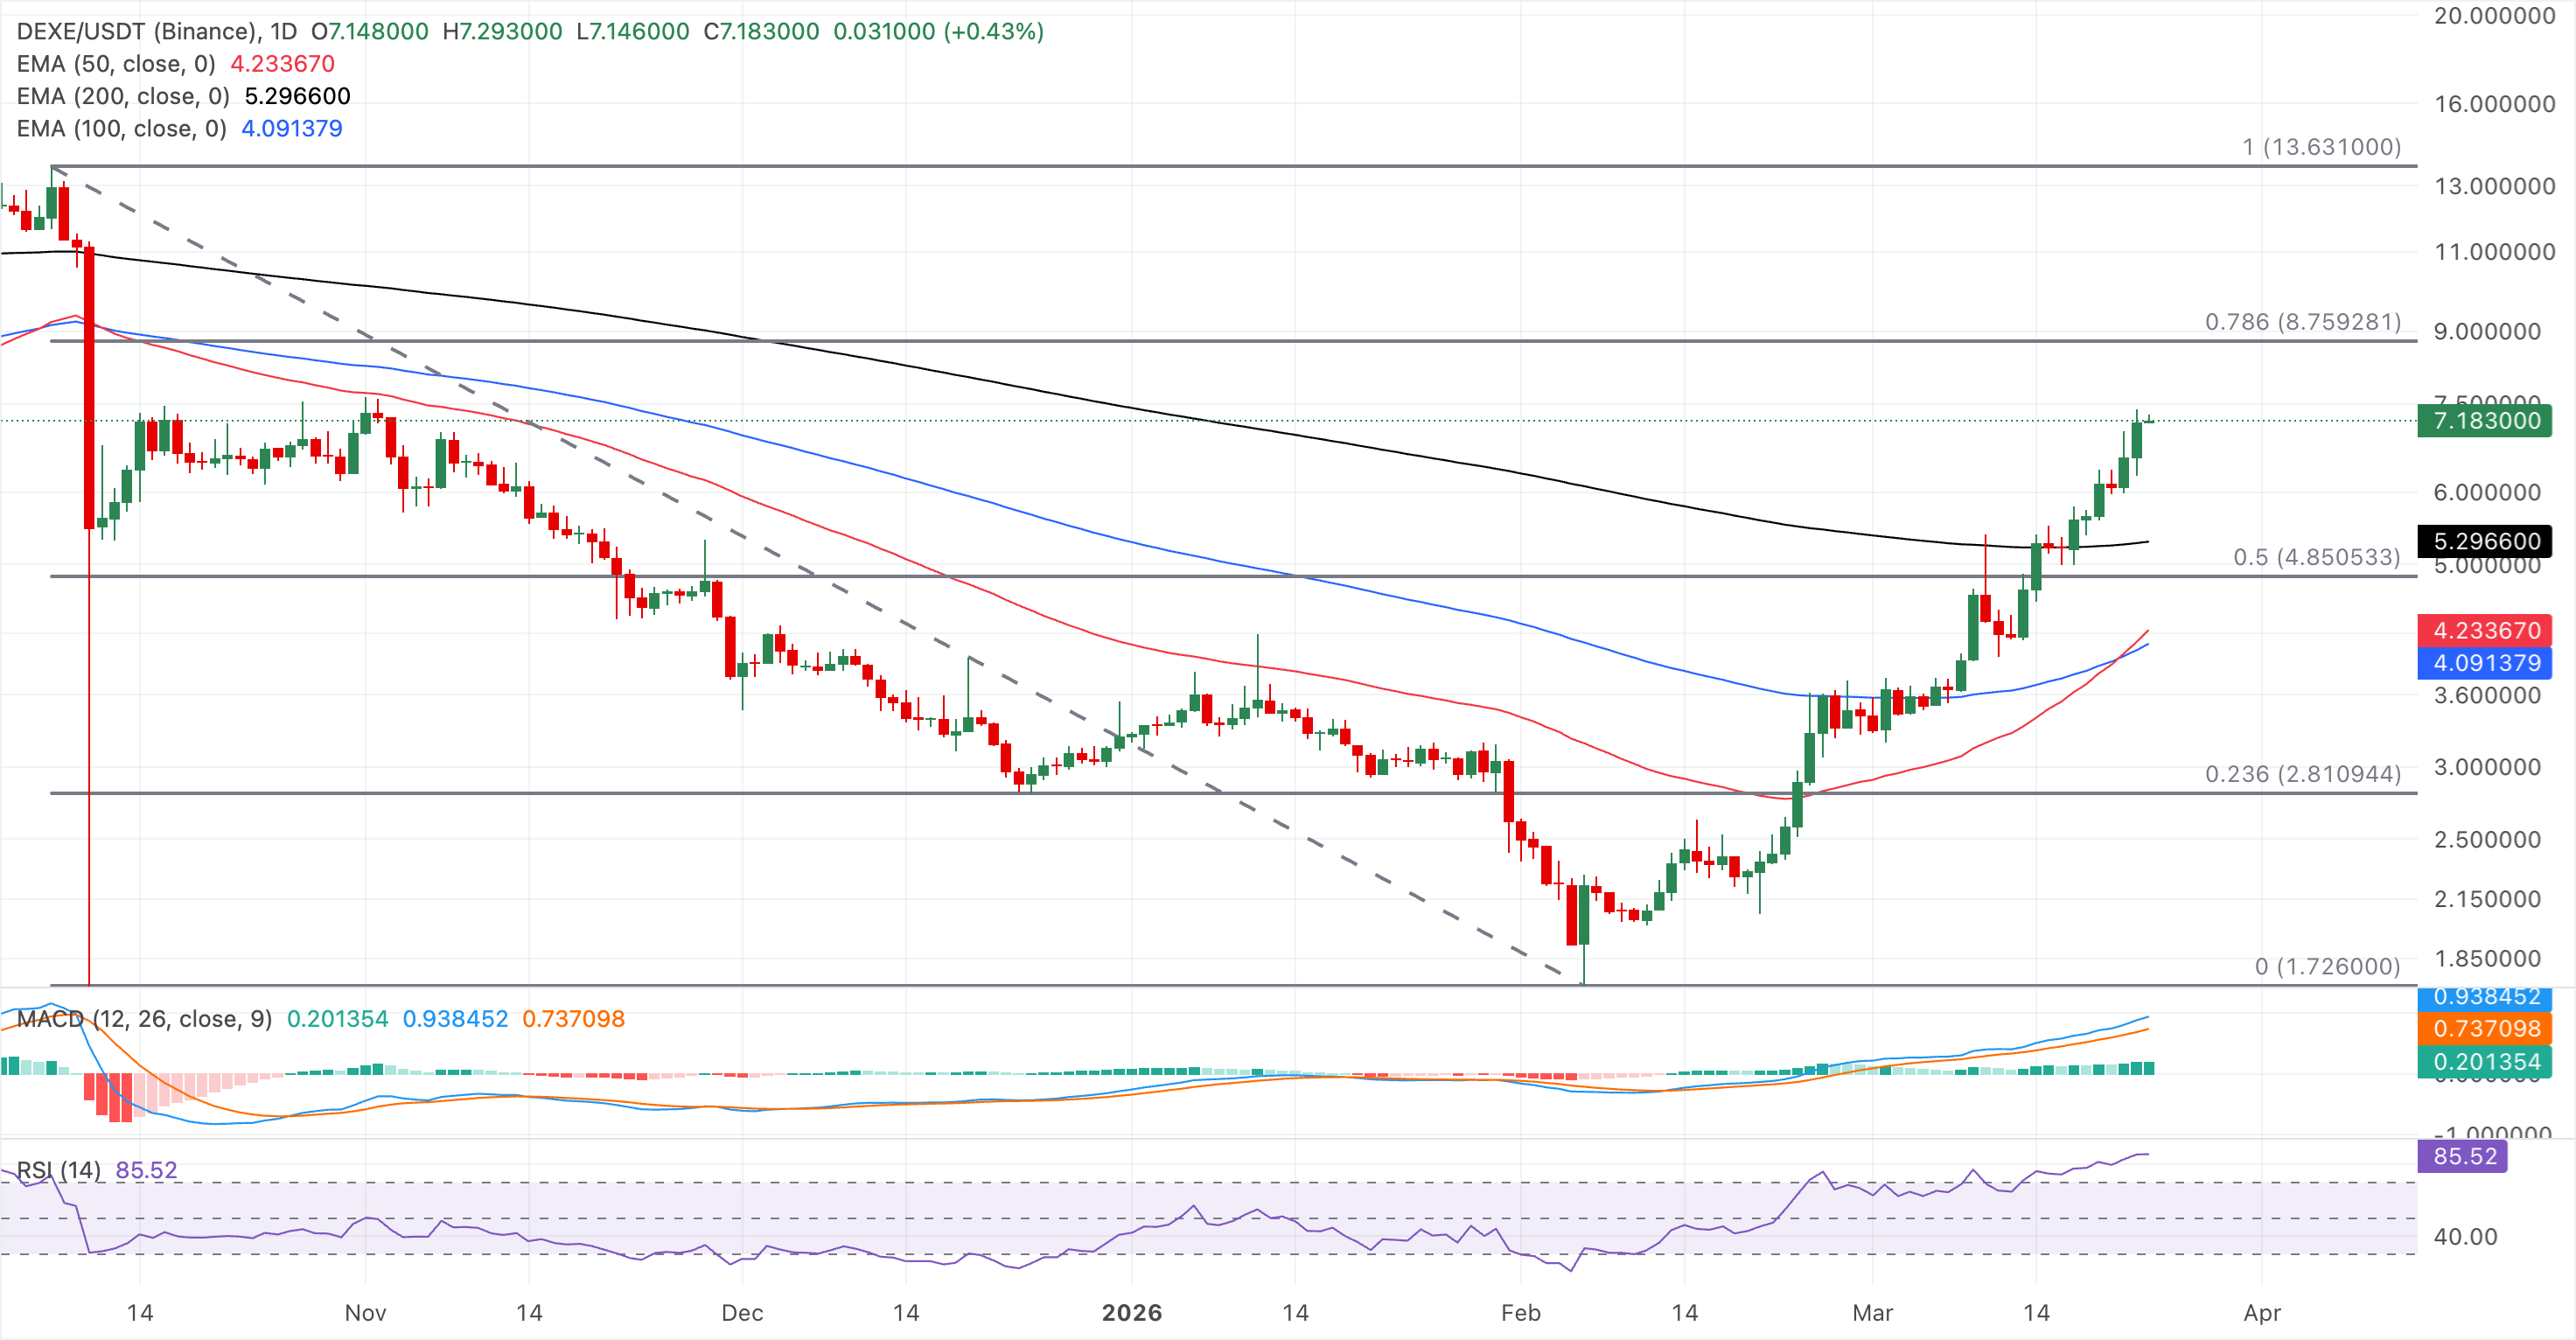
On the downside, initial support emerges at the 200-day EMA at $5.29, followed by the 50% retracement at $4.85 if profit-taking deepens.
Meanwhile, Sign is up 4% at the time of writing on Monday, extending gains above the $0.0500 psychological level. The rising 50- and 100-day EMAs are on the verge of a bullish crossover, which could confirm the near-term bullish bias.
The MACD remains just above the zero line, with the MACD line edging over its signal line and a modest positive histogram, suggesting rebuilding upside momentum after the recent consolidation. The RSI at 72 stays in overbought territory but has flattened, indicating strong but no longer accelerating buying pressure.
Initial support lies at the recent breakout area near $0.0500, followed by the resistance-turned-support R2 Pivot Point at $0.04762.
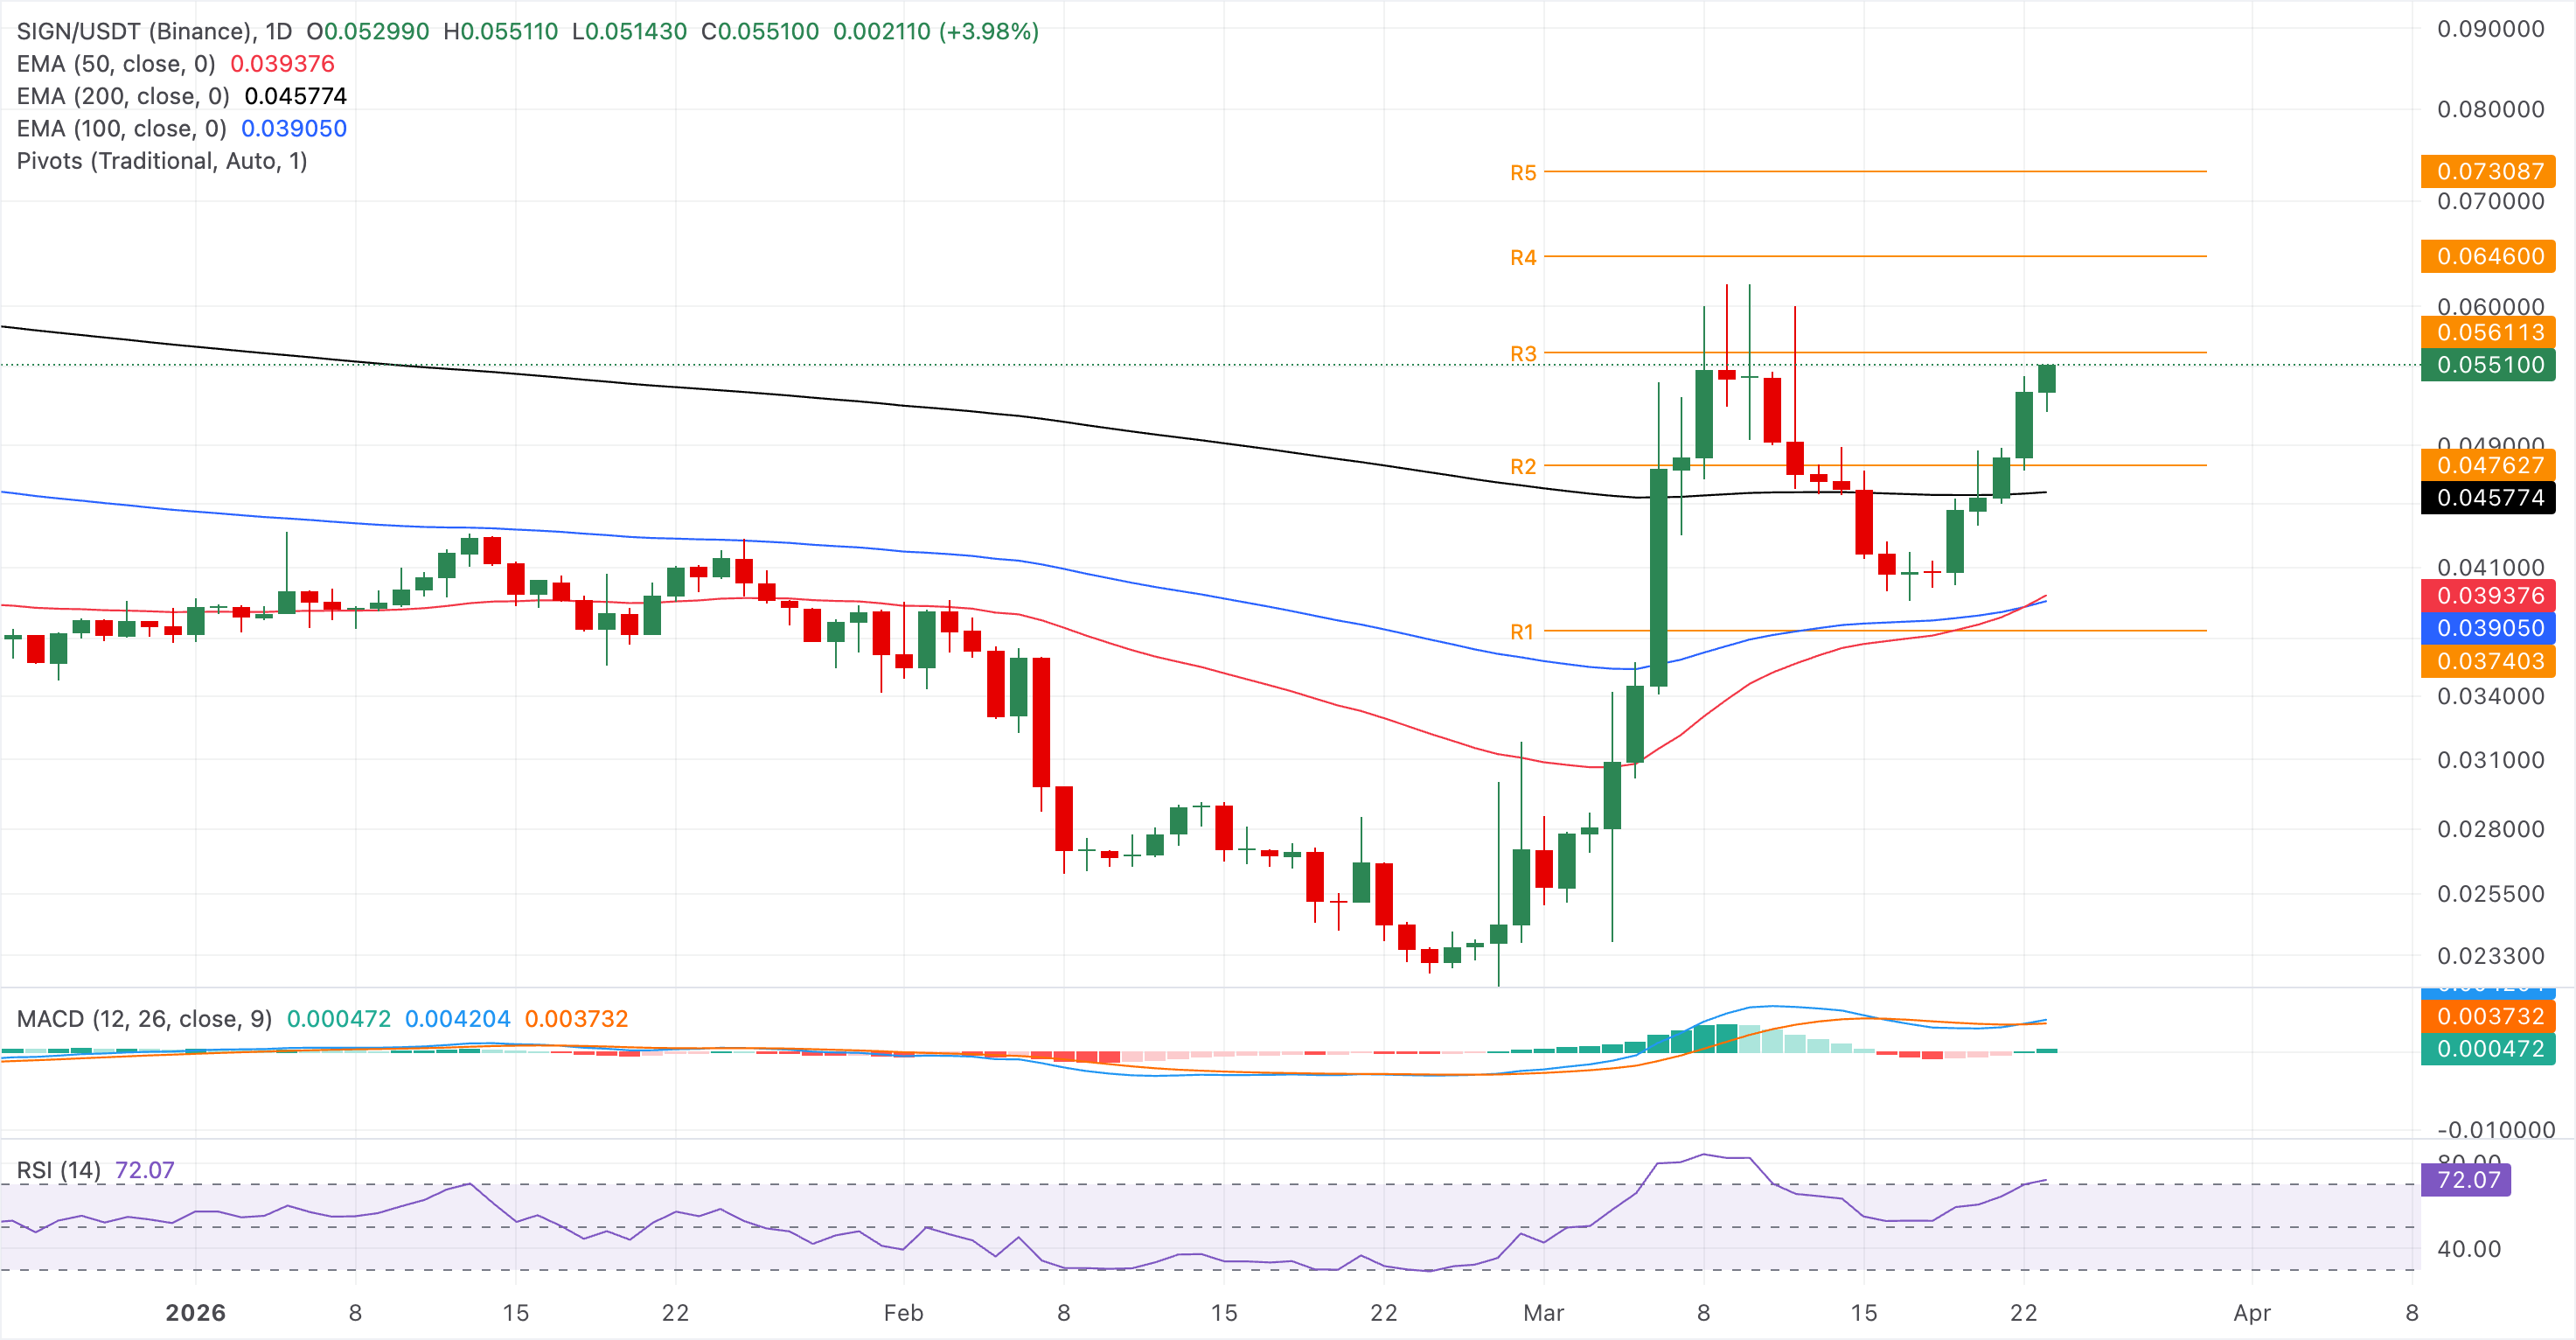
On the upside, immediate resistance lies at the R3 Pivot Point at $0.056, and a sustained close above this level could extend the uptrend toward the R4 Pivot Point at $0.064.
(The technical analysis of this story was written with the help of an AI tool.)
Author

Vishal Dixit
FXStreet
Vishal Dixit holds a B.Sc. in Chemistry from Wilson College but found his true calling in the world of crypto.



