Chainlink Elliott Wave technical analysis [Video]
![Chainlink Elliott Wave technical analysis [Video]](https://editorial.fxstreet.com/images/Markets/Currencies/Cryptocurrencies/Coins/Chainlink/Chainlink_Crypto_31_02.jpg)
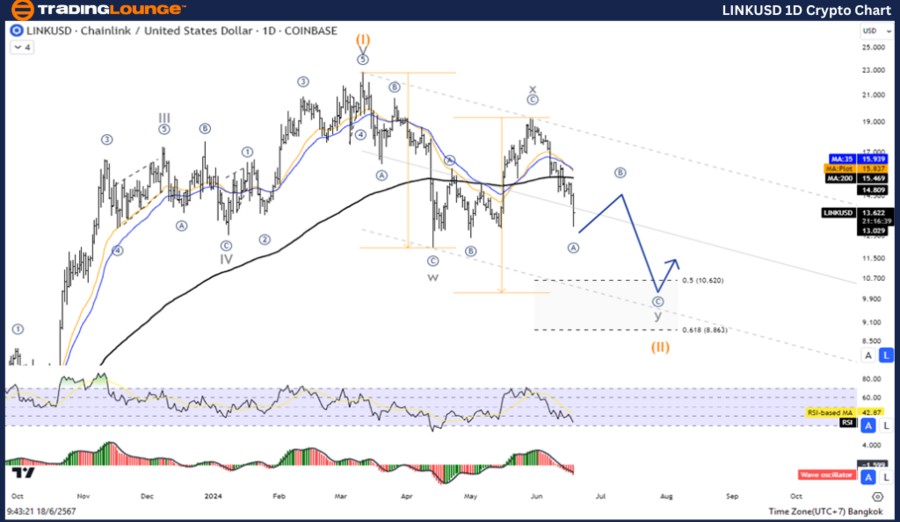
LINK/USD Elliott Wave technical analysis
Function: Counter Trend.
Mode: Corrective.
Structure: Double Corrective.
Position: Wave Y.
Direction next higher degrees: Wave ((II)) of Impulse.
Wave cancel invalid Level: 8.498.
Details: Wave (II) is equal to 61.8% of Wave (I) at 8.86 Level.
ChianLink/ U.S. dollar(LINKUSD)Trading Strategy: ChainLink overall is still in the period of correction. In the position of wave (II) with a double corrective pattern, the view is therefore for a short-term pullback before rising again in wave (III), waiting for the correction to complete to rejoin the uptrend.
ChainLink/ U.S. dollar(LINKUSD)Technical Indicators: The price is below the MA200 indicating a downtrend, The Wave Oscillator is a Bearish Momentum.
LINK/USD Elliott Wave analysis daily chart
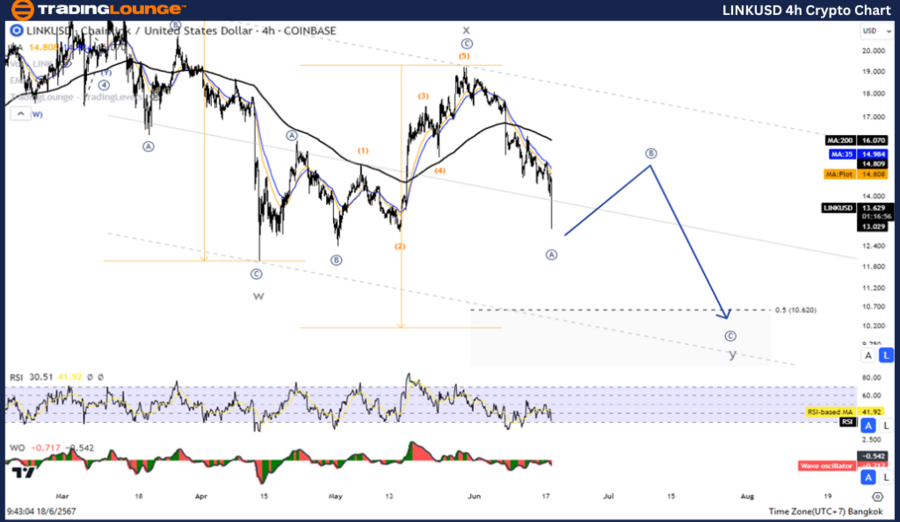
LINK/USD Elliott Wave technical analysis four-hour chart
Function: Counter Trend.
Mode: Corrective.
Structure: Double Corrective.
Position: Wave Y.
Direction Next higher Degrees: Wave ((II)) of Impulse.
Wave Cancel invalid Level: 8.498.
Details: Wave (II) is equal to 61.8% of Wave (I) at 8.86 Level.
ChainLink/ U.S. dollar(LINKUSD)Trading Strategy: Chainlink overall is still in the period of correction. In the position of wave (II) with a double corrective pattern, the view is therefore for a short-term pullback before rising again in wave (III), waiting for the correction to complete to rejoin the uptrend.
Chainlink/ U.S. dollar(LINKUSD)Technical Indicators: The price is below the MA200 indicating a downtrend, The Wave Oscillator is a Bearish Momentum.
Chainlink Elliott Wave technical analysis [Video]
Author

Peter Mathers
TradingLounge
Peter Mathers started actively trading in 1982. He began his career at Hoei and Shoin, a Japanese futures trading company.


