Cardano Price Forecast: ADA on-chain signals bottom amid rising TVL
- Cardano hovers above $0.26 on Tuesday following a 4% rebound the previous day to hold ground at a crucial support level.
- DeFi data shows a rising trend in Cardano’s TVL over the last six months, suggesting increased user activity.
- On-chain data highlights Cardano as oversold amid bearish retail sentiment, suggesting a high likelihood of a rebound.

Cardano (ADA) trades above $0.26 at press time on Tuesday, following a 4% recovery on Monday, aligning with the broader market recovery as the US halts attacks on Iranian power plants, easing pressure in the Middle East. A gradual increase in Cardano’s Total Value Locked (TVL) suggests network growth, while on-chain indicators signal oversold conditions and a bearish tilt among retail traders, which typically lead to a rebound.
The technical outlook for Cardano is mixed as momentum stays low.
On-chain and DeFi data signal upside
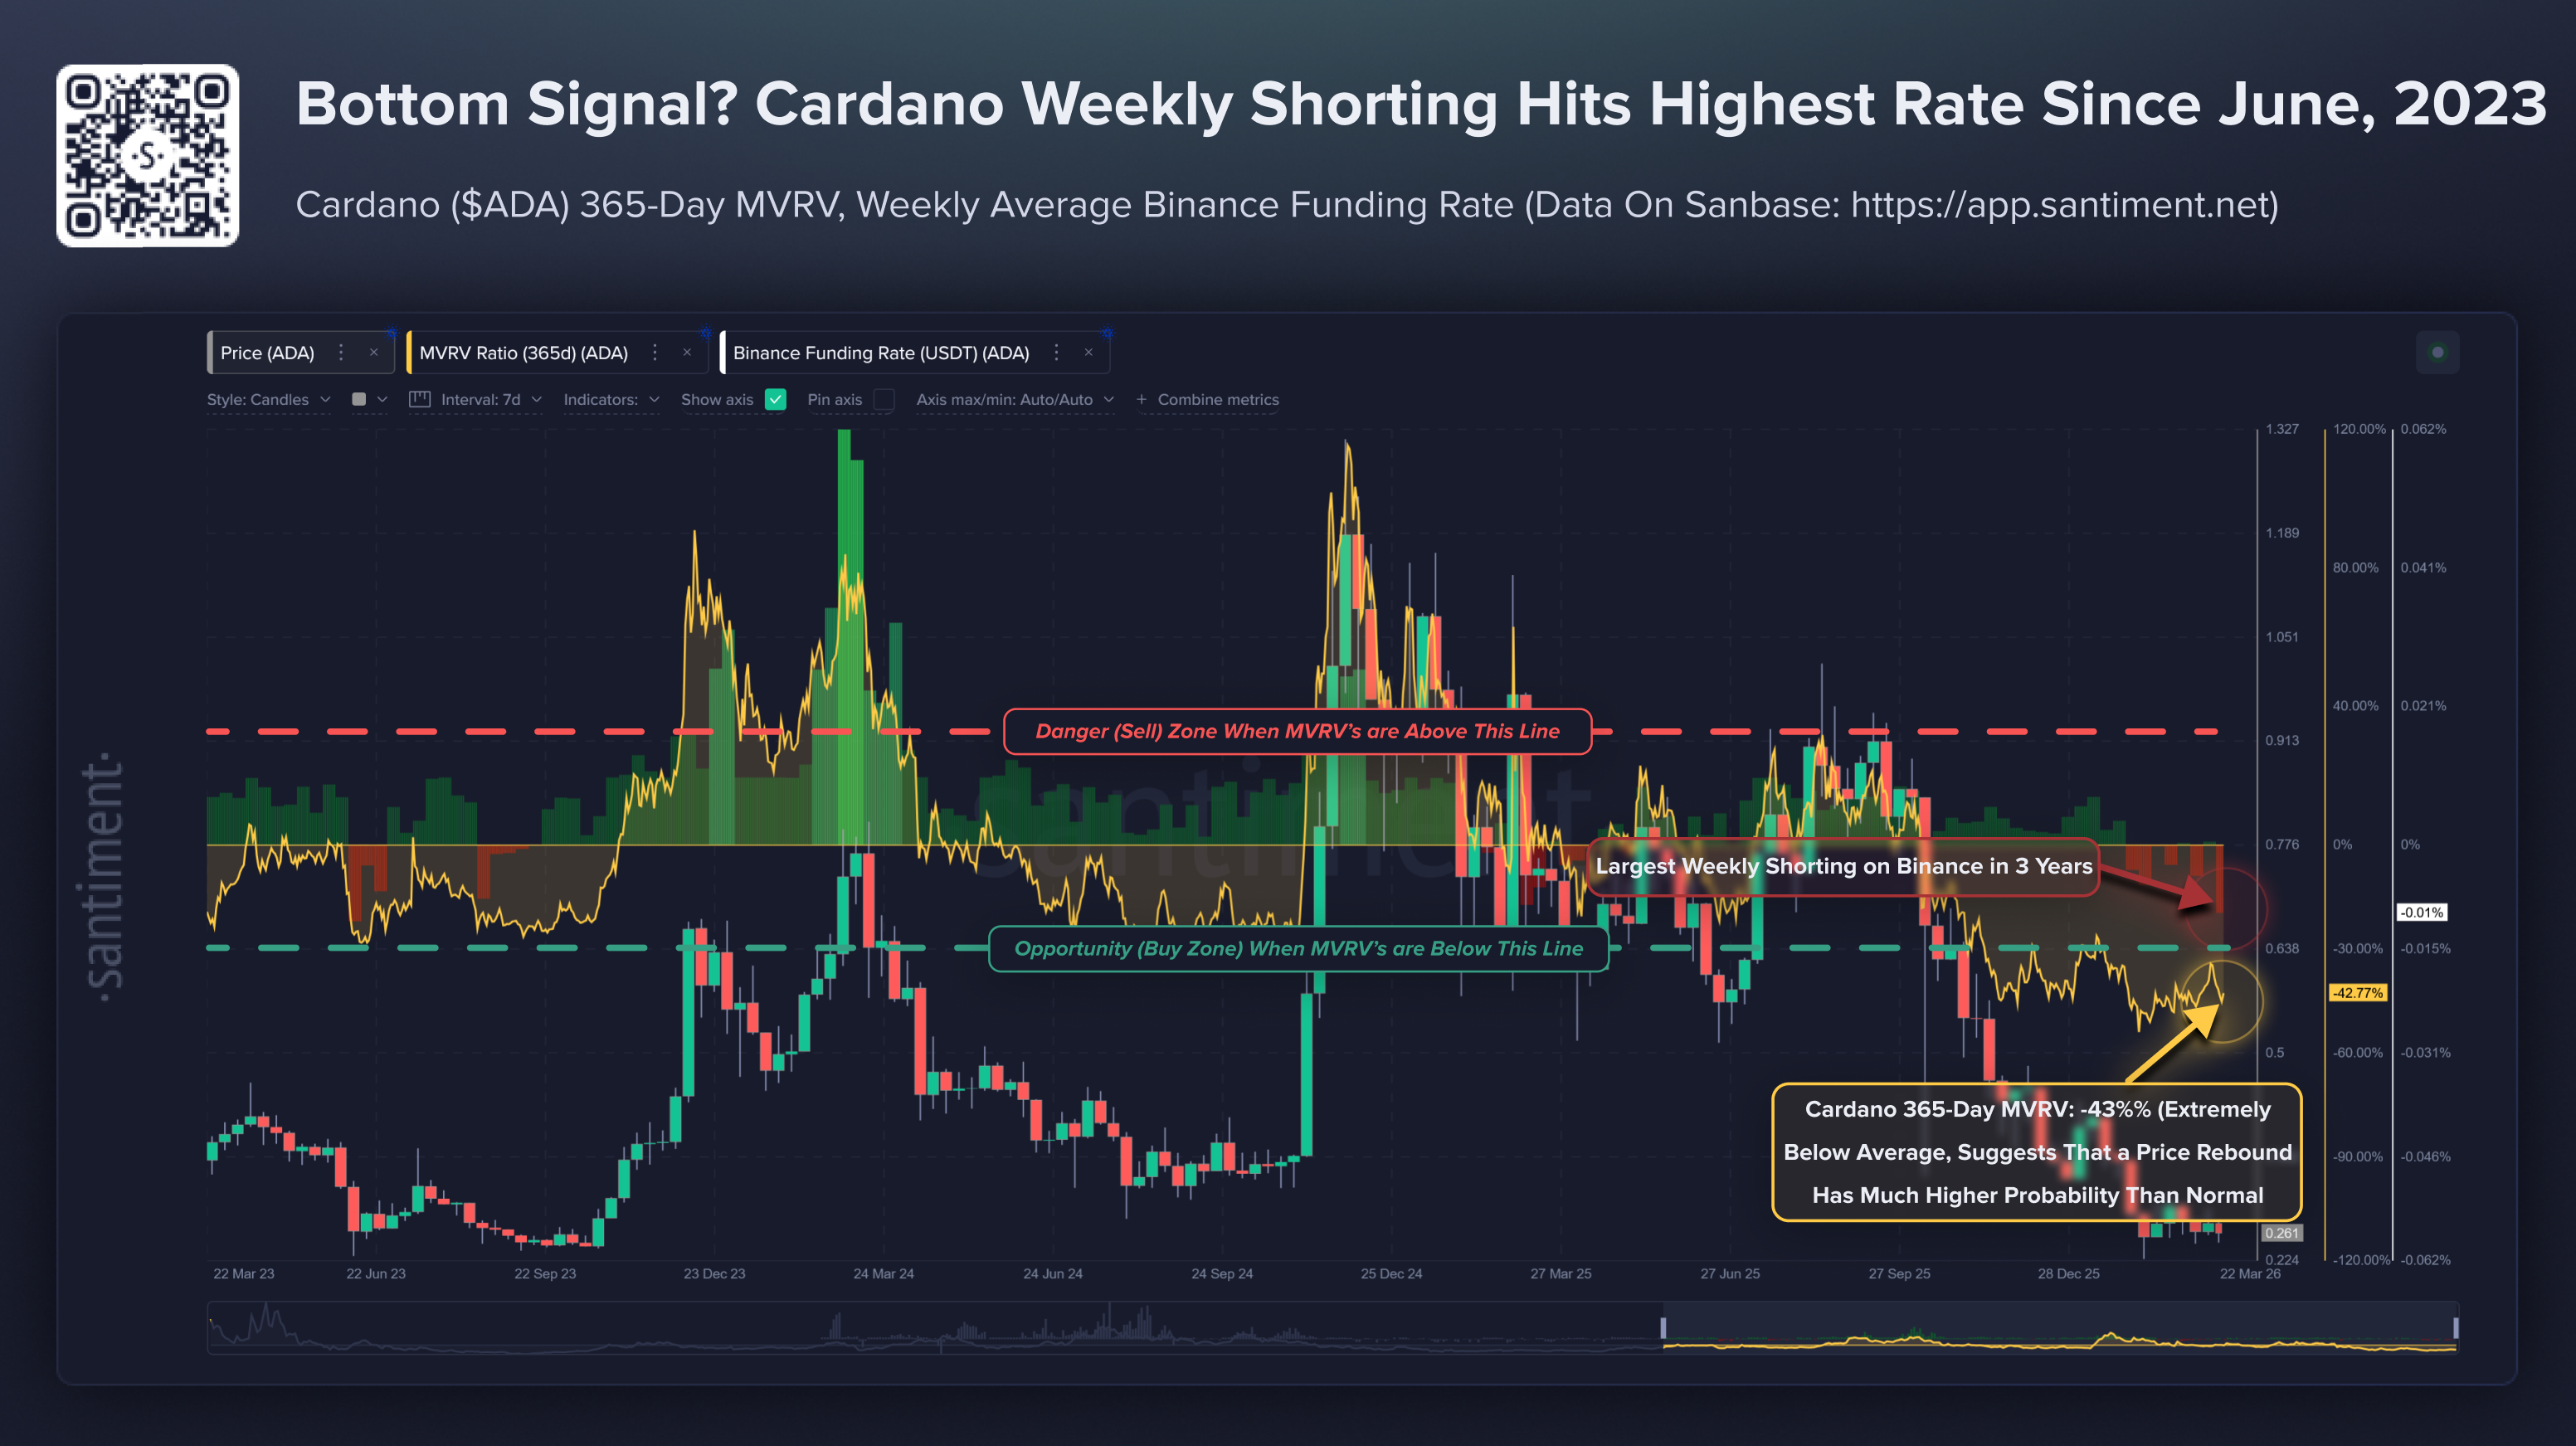
Santiment, an on-chain data analytics platform, shared an insight on Cardano, highlighting it as extremely oversold. The 365-day Market Value to Realized Value (MVRV) ratio is at -42.77%, suggesting that the average value of ADA tokens that moved on-chain over the same period is in the red.
Meanwhile, the funding rate on Binance is negative, marking the largest weekly short-side buildup in Cardano over the last three years. However, a typical rise in retail bearish interest often leads to a bullish spike.
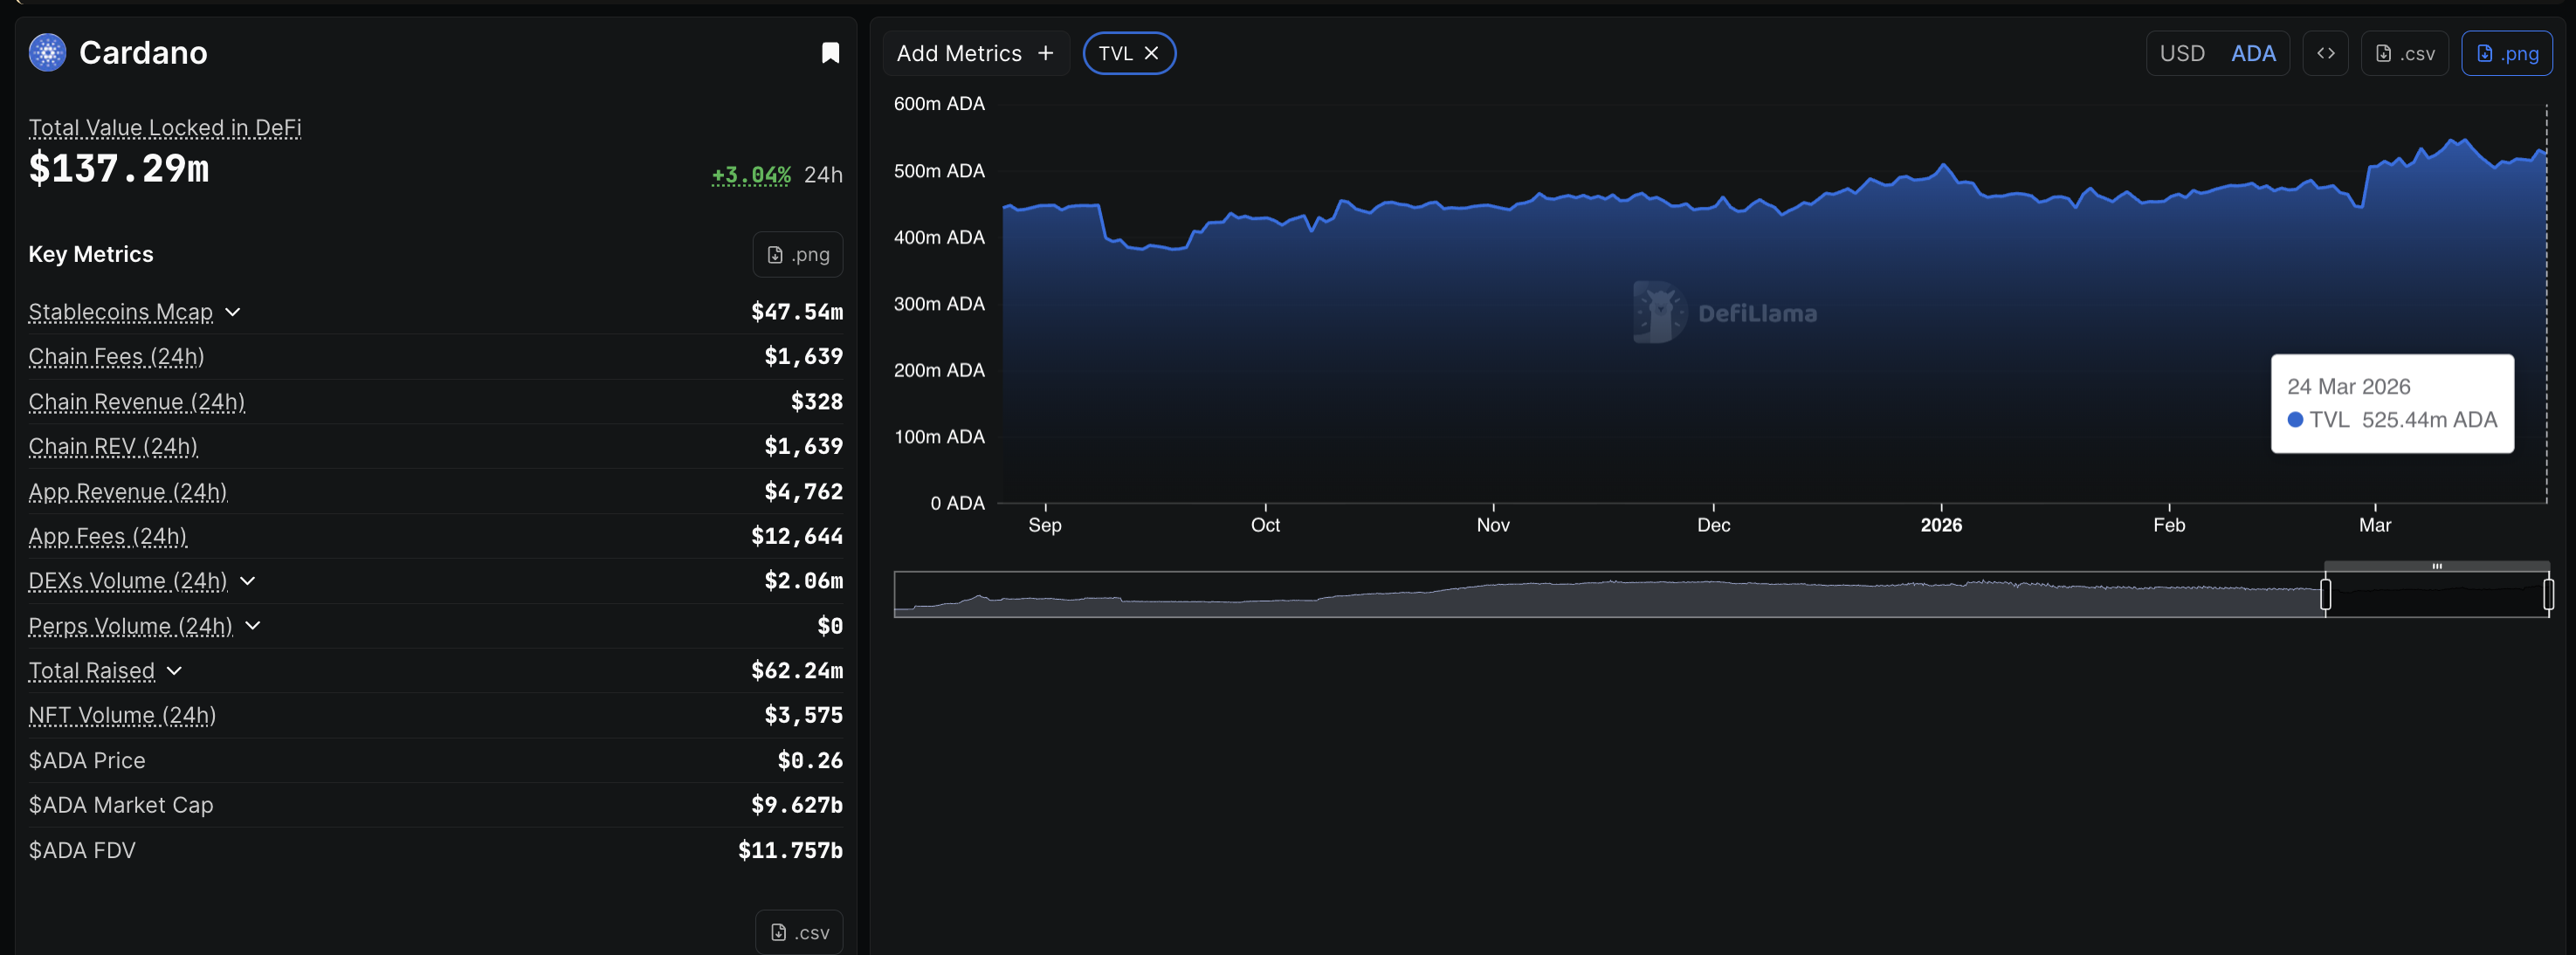
On the other hand, DeFiLlama data shows that Cardano’s TVL is up 3% over the last 24 hours to 525.44 million ADA, reflecting steady network demand. Cardano’s TVL has shown a largely upward trend since the September pullback, reaffirming demand for the blockchain in the crypto market.
Technical outlook: Will Cardano extend its recovery?
Cardano is holding steady above $0.2600 at press time on Tuesday, holding ground above the $0.2436 support level, marked by the February 5 low. The near-term bias is mildly bullish as ADA signals a potential upward trend within a consolidation range, with the upper ceiling at $0.2991, last tested on February 26.
However, ADA remains below the 50-, 100-, and 200-day Exponential Moving Averages (EMAs), which continue to slope lower and cap recovery attempts.
Momentum has faded again, with the Moving Average Convergence Divergence (MACD) slipping back below the signal line, but it remains flat. Meanwhile, the Relative Strength Index (RSI) at 45 moves parallel to the midline, reflecting a weak buying/selling interest.
On the downside, the $0.2436 support level caps the downside risk toward the S1 and S2 Pivot Points at $0.2298 and $0.1786, respectively.
(The technical analysis of this story was written with the help of an AI tool.)
Author

Vishal Dixit
FXStreet
Vishal Dixit holds a B.Sc. in Chemistry from Wilson College but found his true calling in the world of crypto.



