Cardano Price Forecast: ADA extends recovery as bullish sentiment builds
- Cardano price extends recovery on Monday after staging a mild rebound in the previous week.
- On-chain and derivatives data back bullish sentiment with rising social dominance, positive funding rates and increasing long bets.
- The technical outlook suggests an upward move as momentum indicators reflect improving conditions.

Cardano (ADA) price is extending gains, trading above $0.25 at the time of writing on Monday after staging a mild rebound the previous week. Strengthening on-chain data and improving derivatives metrics support a further upward move. On the technical side, strengthening momentum indicators also favor a potential rally for ADA in the coming days.
Cardano’s on-chain and derivatives data point to a bullish bias
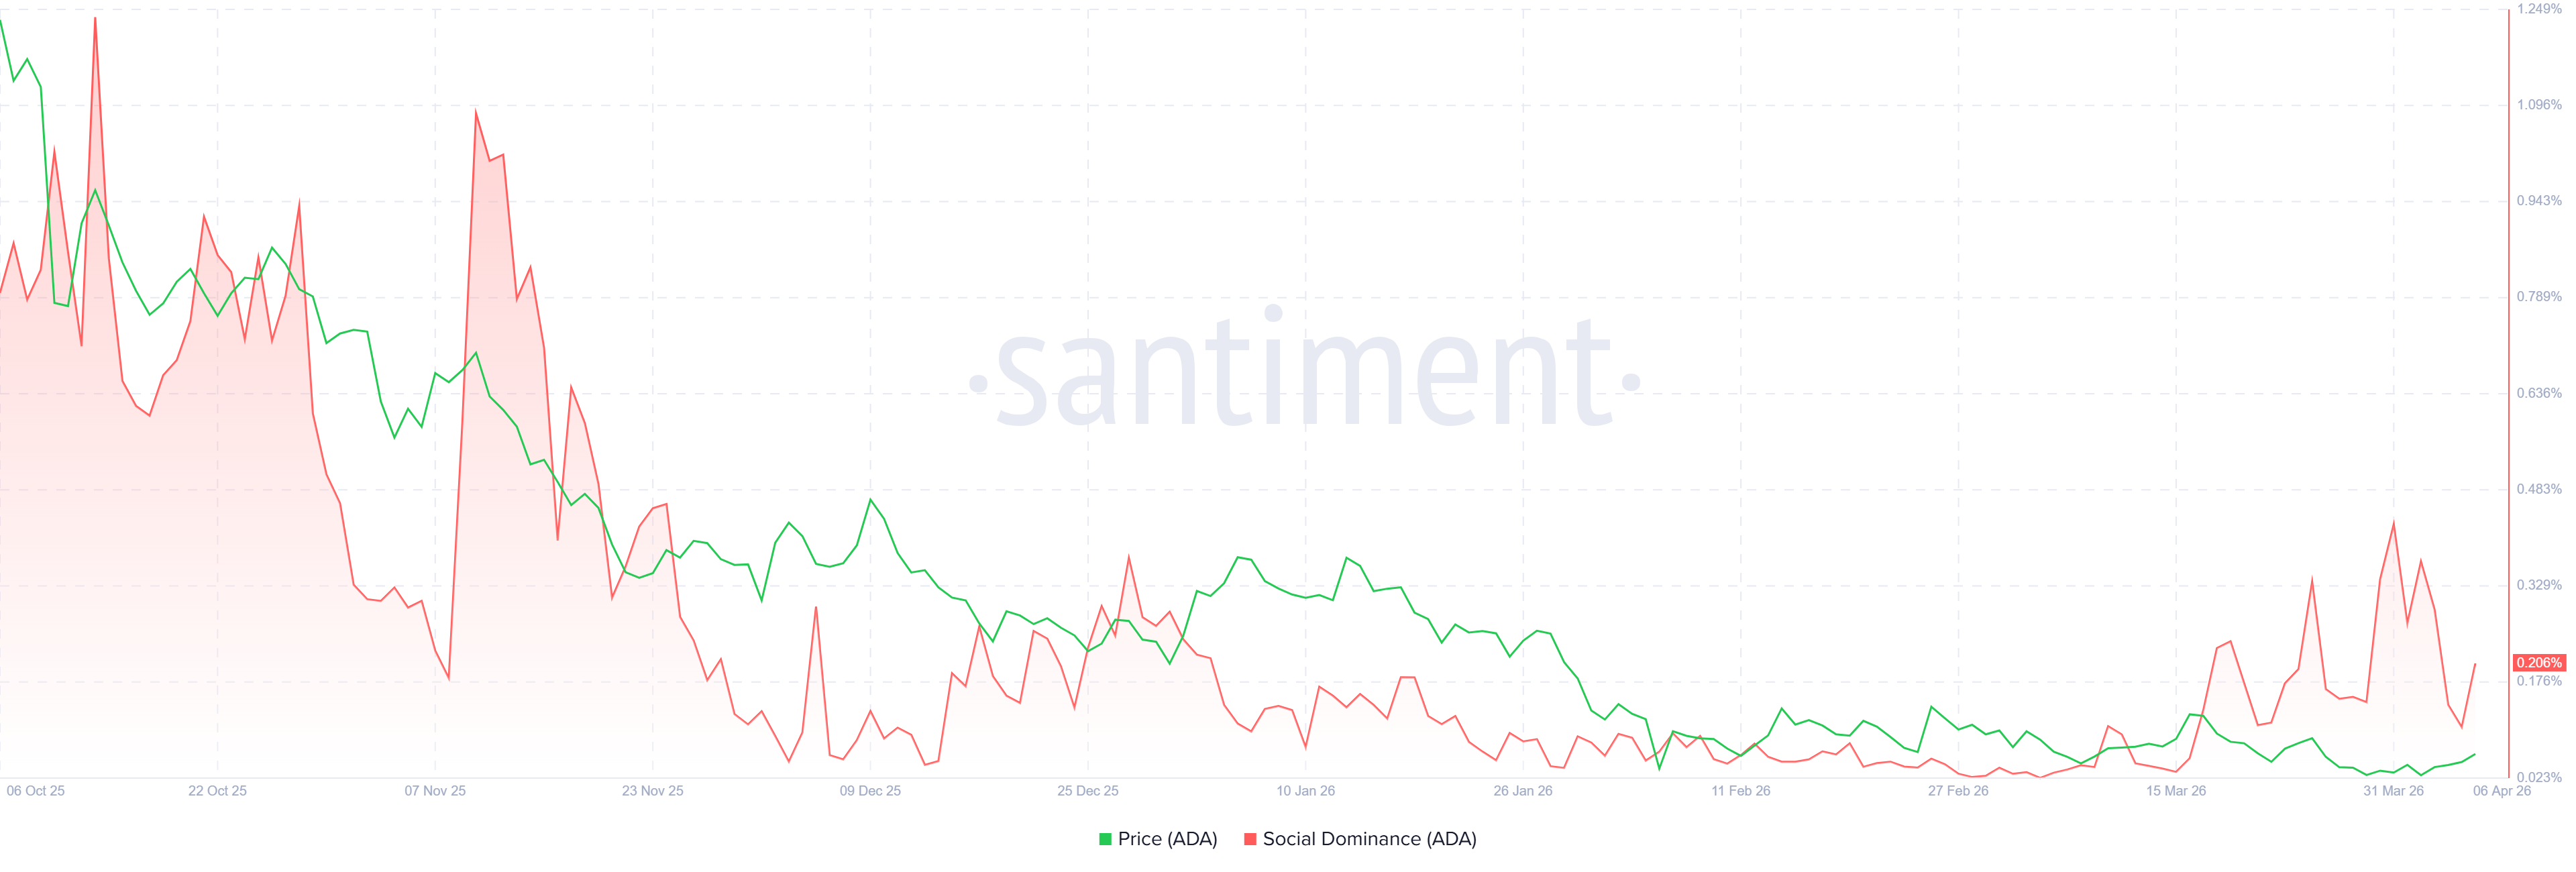
Santiment’s Social Dominance metric for Cardano supports a positive outlook. The index measures the share of ADA-related discussions across the cryptocurrency media. It has been rebounding slightly, reading 0.206% on Monday. This rise indicates growing market interest and strengthening sentiment among ADA investors.
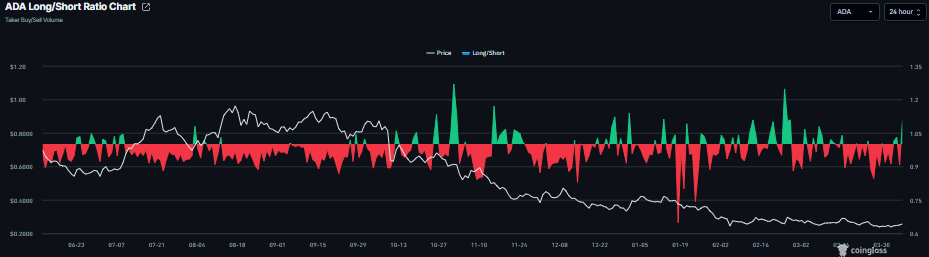
On the derivatives side, CoinGlass’s long-to-short ratio for Cardano reads 1.01 on Monday. This ratio, which is above 1, indicates that most traders are betting on the asset’s price to rally.
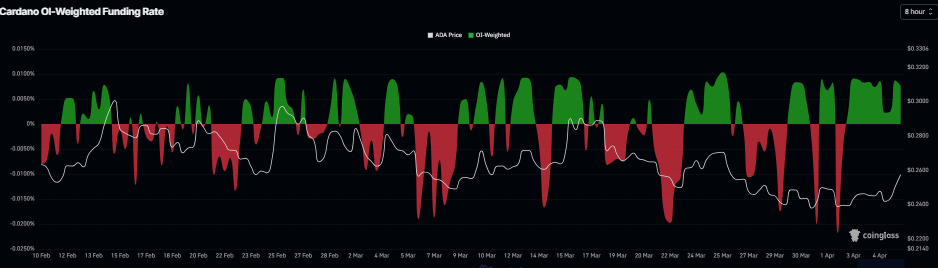
In addition, Cardano’s funding rates flipped positive on Thursday and have remained positive, surging to 0.0076 on Monday, indicating that longs are paying shorts. Historically, as shown in the chart below, when funding rates have flipped from negative to positive and risen, the Cardano price has surged.
Cardano Price Forecast: ADA could extend gains if it closes above $0.27
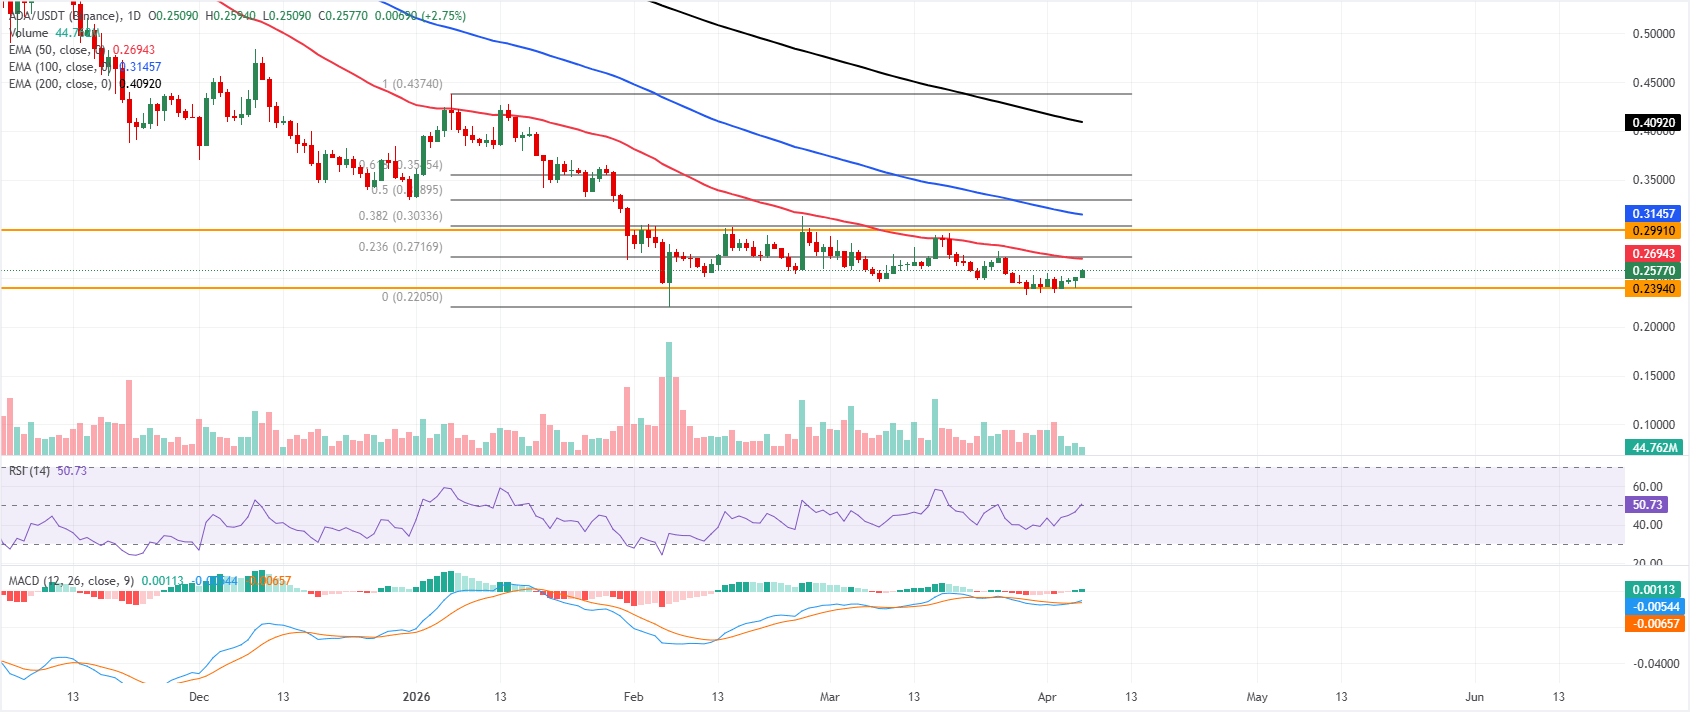
Cardano price is trading above $0.35 on Monday after rebounding slightly last week. The near-term bias is mildly bullish as the price extends its recovery, nearing the key resistance at the 50-day EMA at $0.27. A breakout suggests an upward move.
The Relative Strength Index (RSI) on the daily chart at 50 leans neutral and signals stabilizing momentum rather than impulsive buying, while the Moving Average Convergence Divergence (MACD) indicator has turned back above the signal line just under the zero mark, hinting at fading downside pressure rather than a confirmed trend reversal.
On the downside, initial support aligns near $0.24 at the marked horizontal level, with a break exposing the lower Fibonacci zone from the $0.22 swing low to the $0.43 high, where deeper pullbacks would refocus attention on the broader bearish structure.
Immediate resistance stands at $0.27, its 50-day EMA, followed by the horizontal cap at $0.2991. A daily close above this band would be needed to argue for a more durable recovery toward the 38.2% retracement at $0.30.
(The technical analysis of this story was written with the help of an AI tool.)
Author

Manish Chhetri
FXStreet
Manish Chhetri is a crypto specialist with over four years of experience in the cryptocurrency industry.




