Cardano Price Forecast: ADA derivatives flag bull trap risk
- Cardano recovers on Wednesday, extending a consolidating move near $0.2500.
- Derivatives data shows an increase in Open Interest, while funding rates and heightened long liquidations reflect bearish sentiment.
- The technical outlook is mildly bearish, as the RSI and MACD indicators continue to signal downside pressure.

Cardano (ADA) extends gains at press time on Wednesday as the broader cryptocurrency market carries the weight of the US-Iran war. Derivatives data signals a bearish incline among traders anticipating a reversal of the near-term recovery. Technically, ADA is at risk of a steeper correction as the RSI and MACD indicators flag persistent downside momentum.
Bearish sentiment dominates ADA derivatives
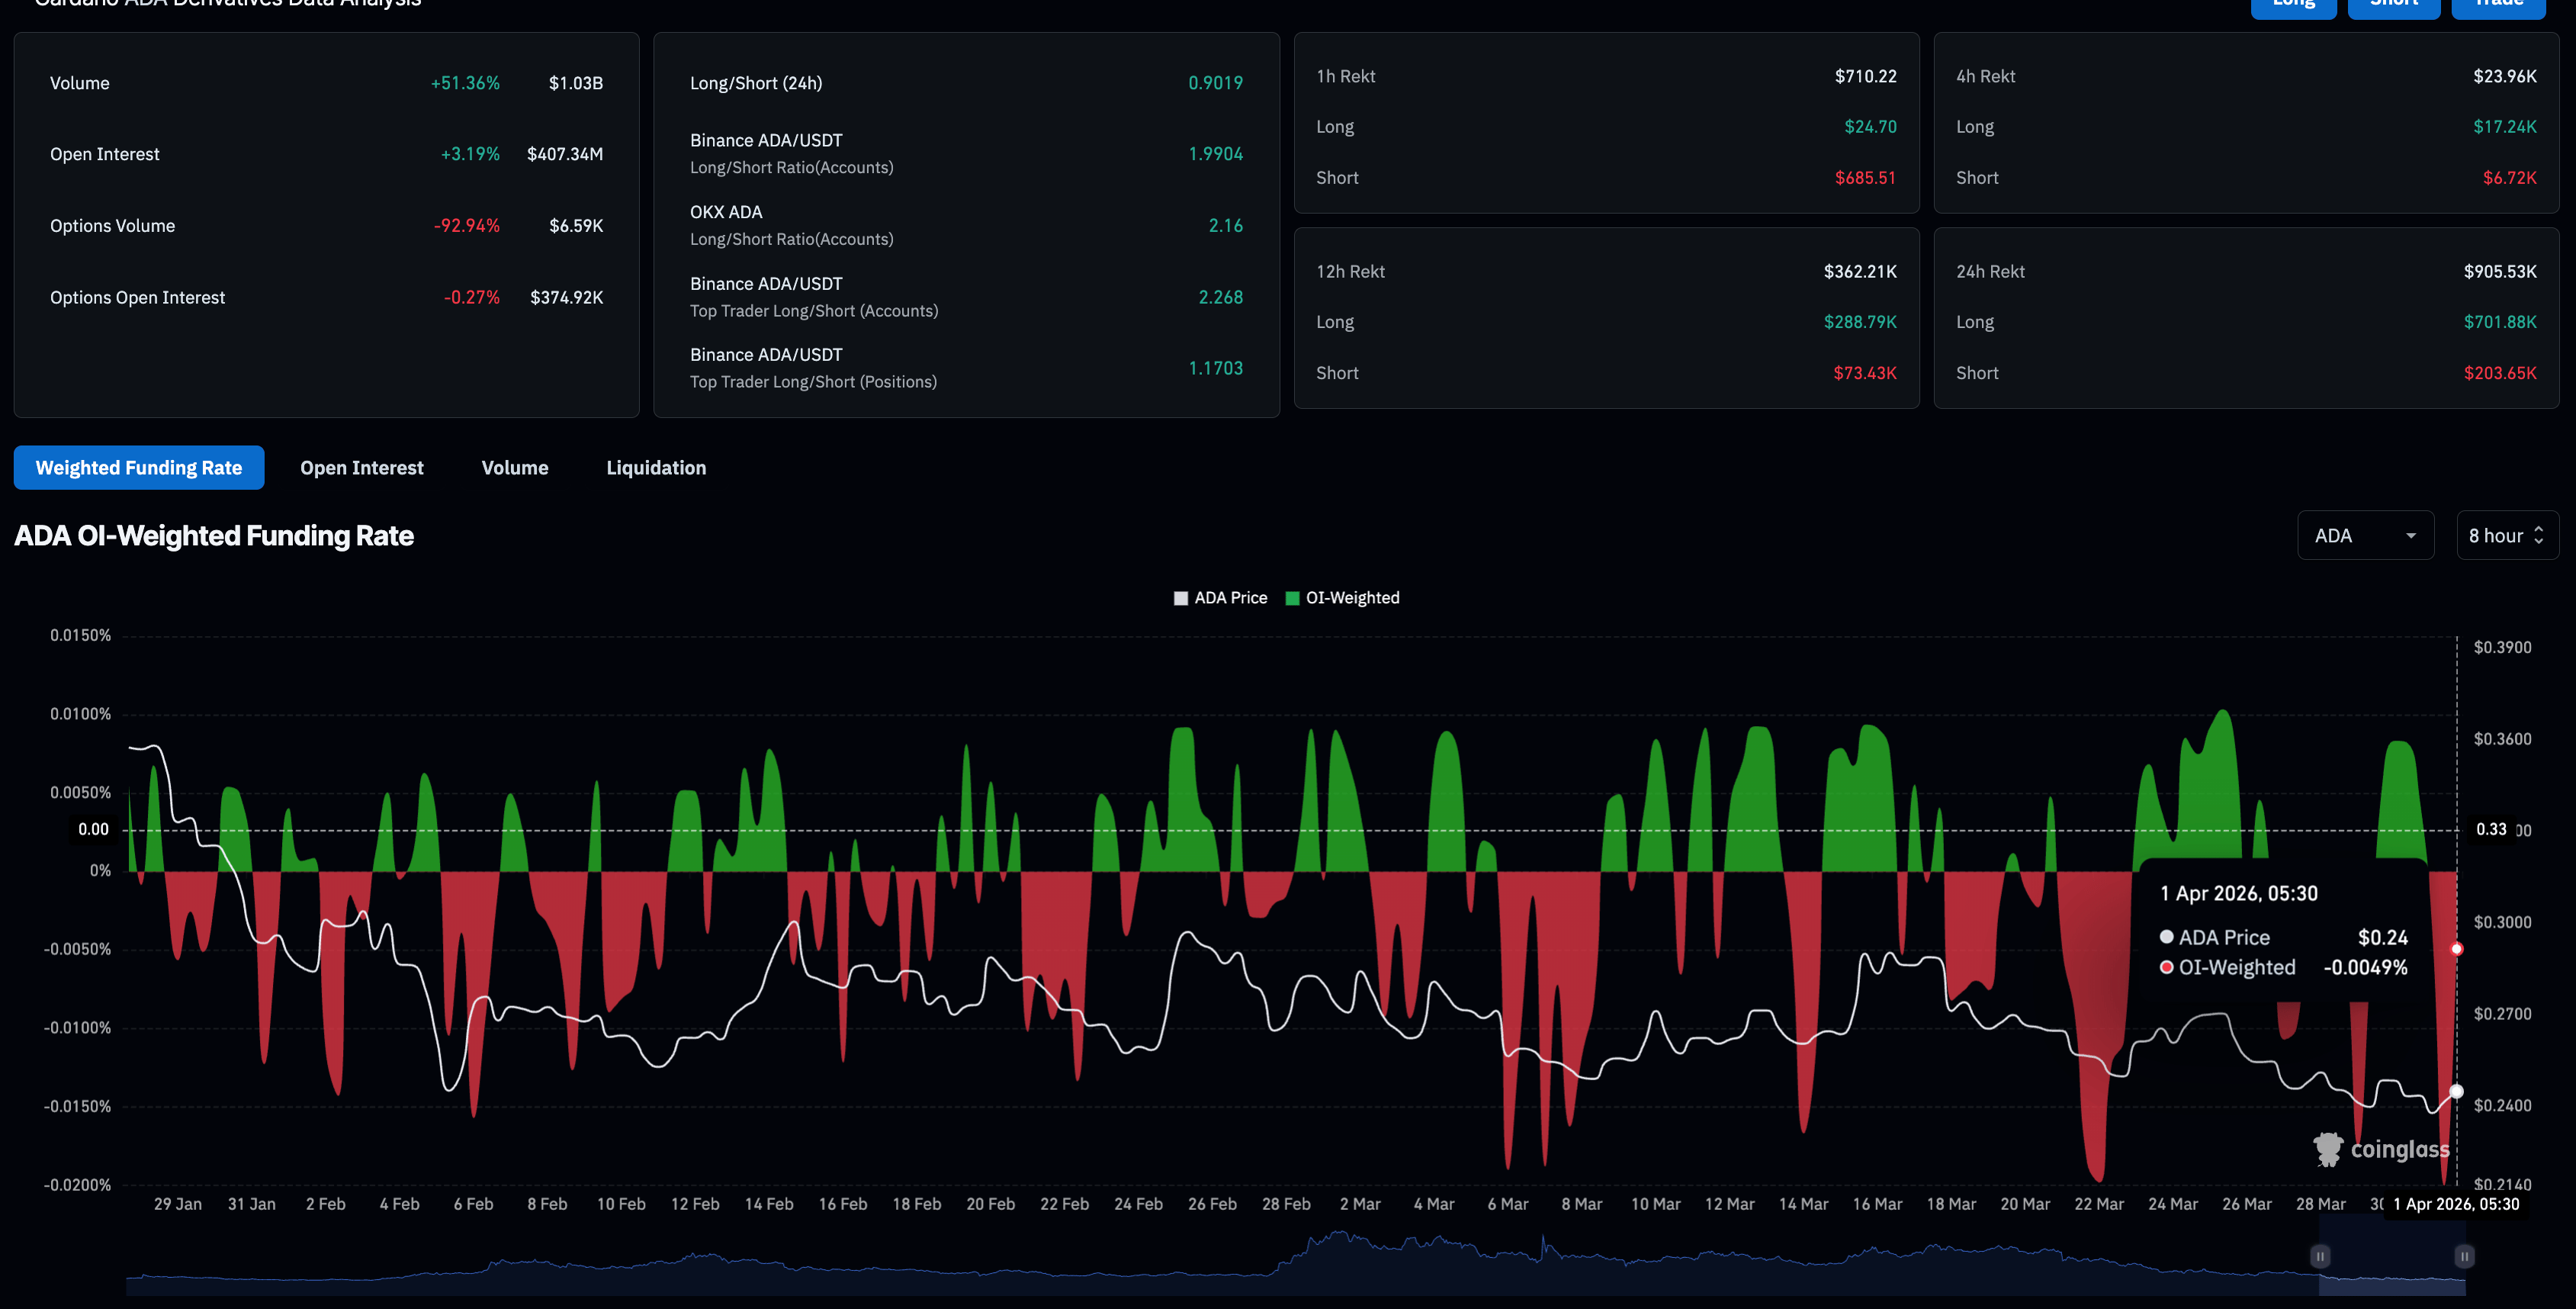
Cardano derivatives have seen a surge in capital inflows over the last 24 hours, but market conditions flag bearish pressure. CoinGlass data shows an over 3% increase in ADA futures Open Interest (OI) over the same period, reaching $407.34 million, indicating a rise in the notional value of outstanding perpetual contracts.
However, this positional buildup lacks a directional signal. The negative funding rate of -0.0049% and liquidations over the past 24 hours totaling $905,530, led by $701,880 in long liquidations, reveal a bearish tilt in the derivatives market.
Despite the intraday recovery, the bearish buildup in ADA derivatives suggests traders anticipate a further correction, which could trap near-term bulls.
Technical outlook: Will Cardano sustain its recovery?
Cardano extends a broadly sideways trend after the 2% decline on Sunday. At the time of writing, Cardano is up over 1% on Wednesday, approaching the $0.2500 level.
Still, the near-term bias is mildly bearish as price holds below the declining 50-, 100- and 200-day Exponential Moving Averages (EMAs), reinforcing a dominant downtrend.
The Moving Average Convergence Divergence (MACD) slips below the signal line, extending the negative histogram bars, suggesting persistent but not aggressive selling pressure. The Relative Strength Index (RSI) at 41 stays below the 50 mark, aligning with subdued bullish momentum and favoring downside risk while this configuration persists.
Looking down, a bearish close to the day would likely extend ADA's decline to the February 6 low at $0.2205, close to the S1 Pivot Point at $0.2179. A decisive close below this cluster would open the door to the S2 Pivot Point at $0.1940.
Immediate resistance for ADA emerges at the 50-day EMA at $0.2738, close to the R1 Pivot Point at $0.2806. Beyond this supply zone, the crucial resistance level caps the upside structure, keeping rallies contained below the February 2 close at $0.2991.
(The technical analysis of this story was written with the help of an AI tool.)
Author

Vishal Dixit
FXStreet
Vishal Dixit holds a B.Sc. in Chemistry from Wilson College but found his true calling in the world of crypto.



