Cardano Elliott Wave technical analysis [Video]
![Cardano Elliott Wave technical analysis [Video]](https://editorial.fxstreet.com/images/Markets/Currencies/Cryptocurrencies/Coins/Cardano/Cardano_Coin_31.jpg)
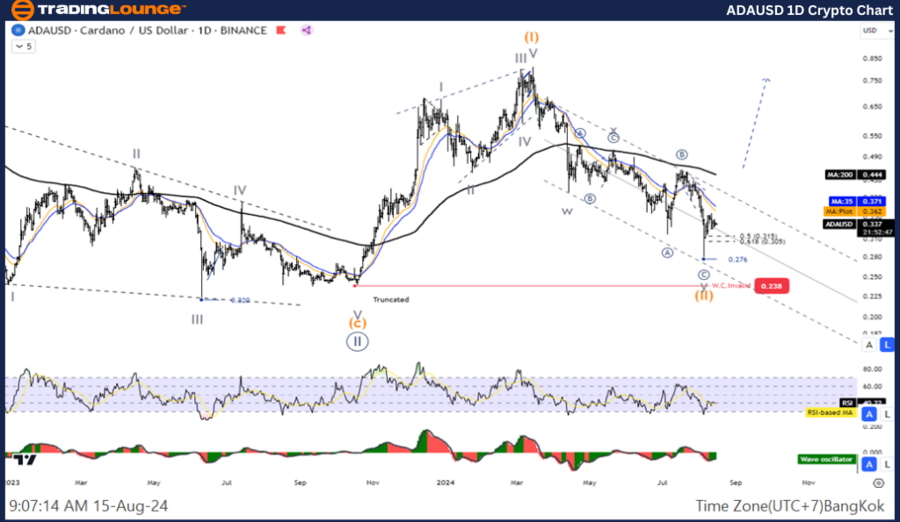
ADA/USD Elliott Wave technical analysis
Function: Counter Trend
Mode: Corrective
Structure: Double Corrective
Position: Wave Y
Direction next higher degrees: Wave (II)
Details: The decline of wave Y is likely to end and the price is re-entering the uptrend.
Cardano/ U.S. dollar (ADAUSD) Trading Strategy: Cadarno's outlook looks like the Wave 1 rally is likely to end. The price is entering a correction in Wave 2, likely to test the 61.8%(0.365) level of Wave 1 before rising again in Wave 3, so wait for the correction to complete for an opportunity to join the trend again.
Cardano/ U.S. dollar(ADAUSD)Technical Indicators: The price is below the MA200 indicating a downtrend, The Wave Oscillator is a Bearish Momentum.
ADA/USD one-day chart
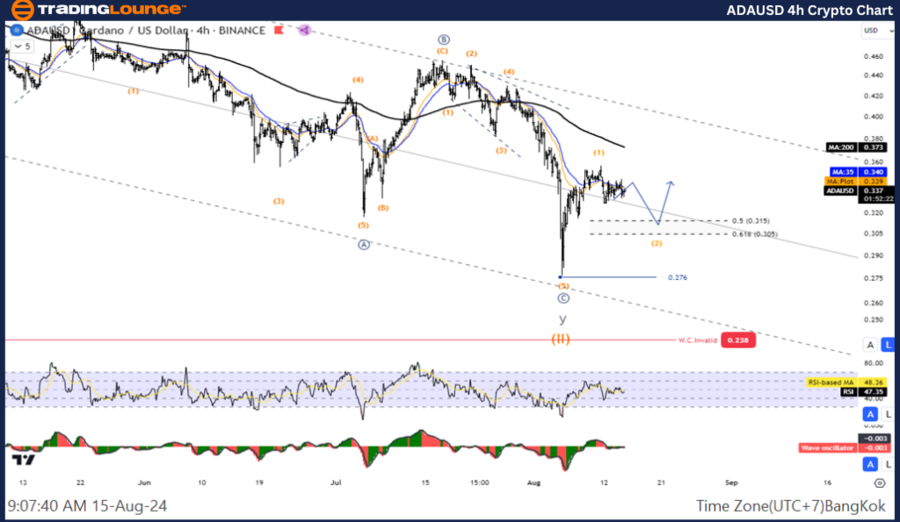
ADA/USD Elliott Wave technical analysis
Function: Counter Trend
Mode: Corrective
Structure: Zigzag
Position: Wave B
Direction next higher degrees: Wave (2) of Impulse
Details: Wave (2) is likely to retrace the 61.8% level of wave (1)
Cardano/ U.S. dollar (ADA/USD) Trading Strategy: Cadarno's outlook looks like the Wave 1 rally is likely to end. The price is entering a correction in Wave 2, likely to test the 61.8%(0.365) level of Wave 1 before rising again in Wave 3, so wait for the correction to complete for an opportunity to join the trend again.
Cardano/ U.S. dollar(ADAUSD)Technical Indicators: The price is below the MA200 indicating a downtrend, The Wave Oscillator is a Bearish Momentum.
ADA/USD four-hour chart
Cardano Elliott Wave technical analysis [Video]
Author

Peter Mathers
TradingLounge
Peter Mathers started actively trading in 1982. He began his career at Hoei and Shoin, a Japanese futures trading company.


