Bitcoin falls below $70,000 amid $4 billion ETF outflows streak
- Bitcoin slips below $70,000 on Tuesday, down roughly 15% over the last four straight weeks of losses.
- Momentum indicators signal increasing selling pressure, reaffirming the bearish technical outlook.
- Technical levels suggest BTC could test the April 12 low at $65,000 if selling pressure continues.

Bitcoin (BTC) price dips below $70,000 on Tuesday, extending the 3% decline from the previous day. Market momentum turned extremely bearish, with Exchange Traded Funds (ETFs) tied to BTC offloading roughly $4 billion since mid-May. The technical indicators suggest that rising selling pressure could extend the breakout of the support trendline to test the $65,000 psychological level.
Bitcoin ETF outflows cross $4 billion since mid-May
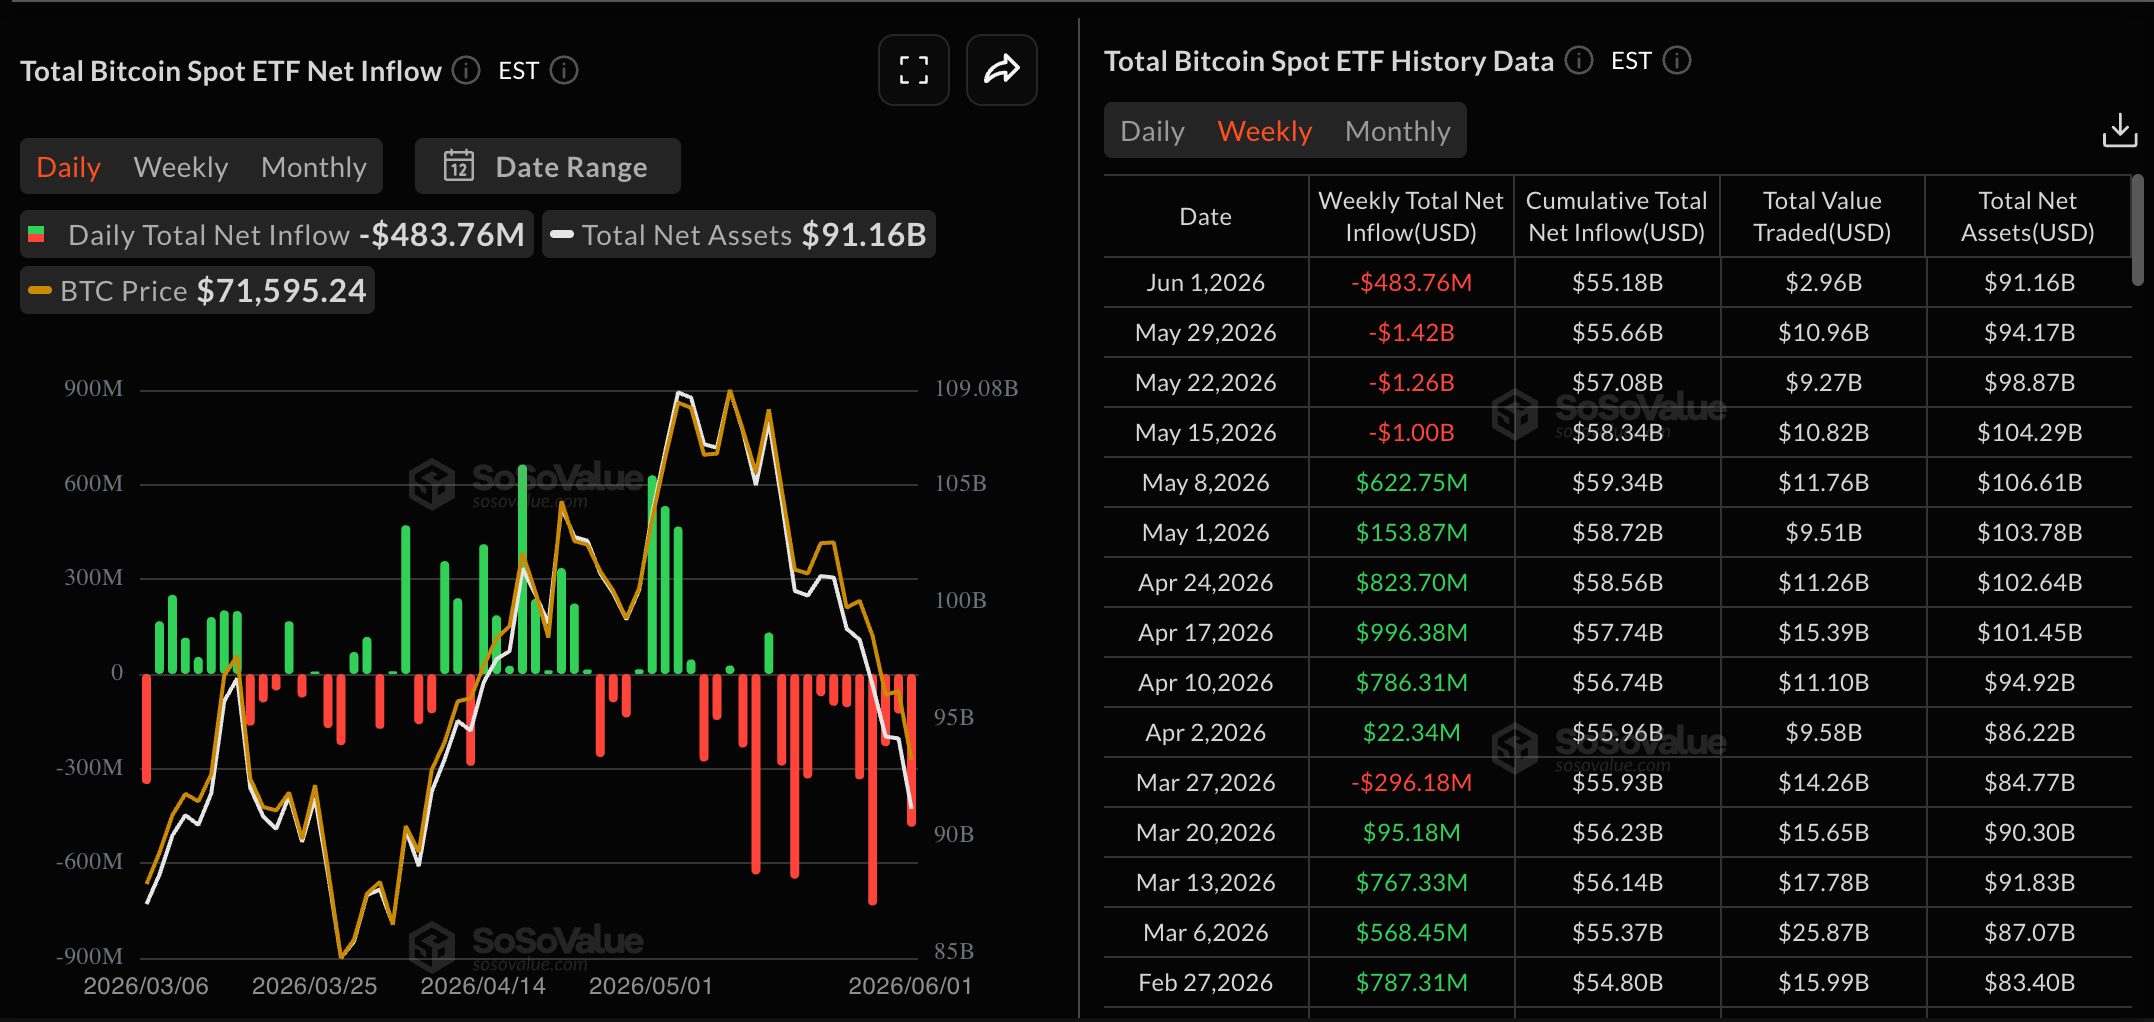
Bitcoin trades below $70,000 for the first time since April 7, likely driven by institutional offloading, with $2.43 billion in outflows recorded in May and Strategy's first-ever sale of 32 BTC on Monday in the last four years. SoSoValue Data shows that Bitcoin ETFs recorded $483.76 million in outflows on Monday, after three consecutive weeks of over $1 billion in outflows, bringing total outflows to over $4 billion since May 11.
Technical outlook: Downside risk in Bitcoin extends to $65,000
Bitcoin extends its fourth consecutive week of decline, representing roughly a 15% loss, clearing the downside toward $65,000, which previously served as a rebound level on March 29. The King Crypto holds a clear bearish bias as price extends below the rising four-month support trendline with the break area near $71,300. The 50-day and 100-day Exponential Moving Averages (EMAs) near $75,798 and $76,340 are significantly above the price, reinforcing the bearish tone.
Bitcoin risks further decline after losing altitude from recent highs and failing to hold above a crucial support trendline. The Relative Strength Index (RSI) around 27 on the daily chart has entered oversold territory, while the negative Moving Average Convergence Divergence (MACD) extends deeper into the negative zone, with its signal line reinforcing bearish momentum.
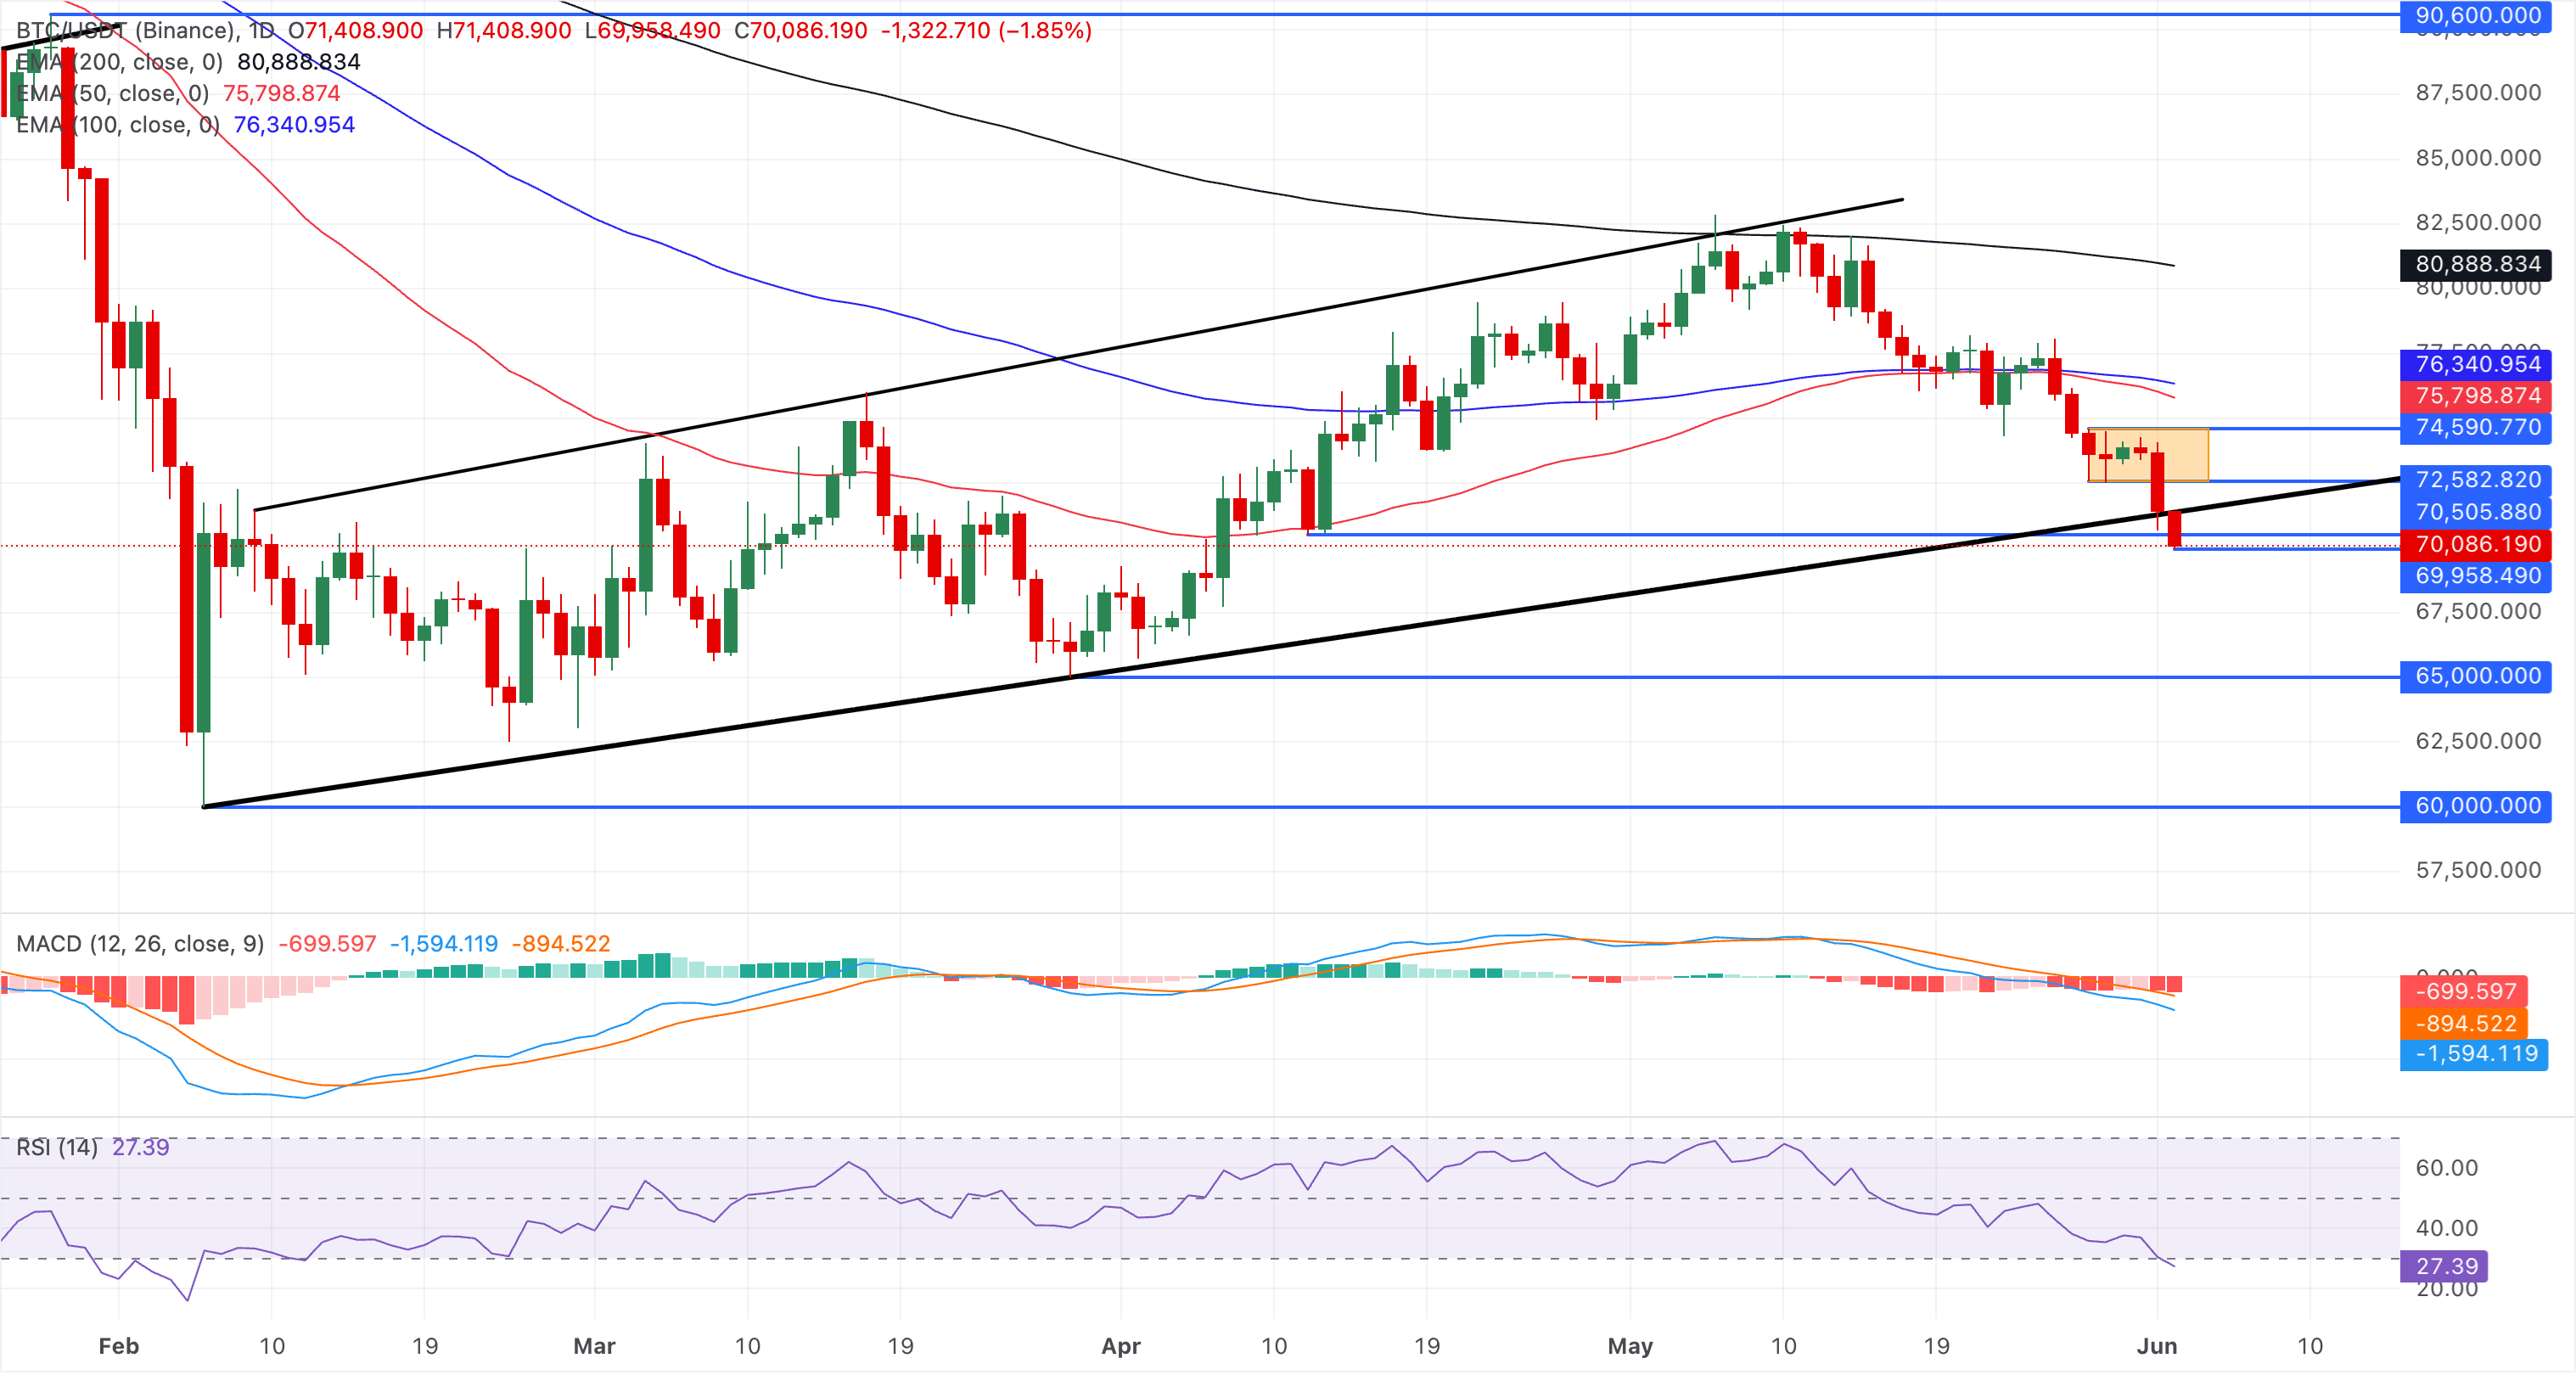
Looking up, a sustained recovery above $70,000 would first need to clear the 50-day EMA near $75,798, followed by the 100-day EMA around $76,340.
(The technical analysis of this story was written with the help of an AI tool.)
(This story was corrected on June 2 at 08:25 GMT to say that the $4 billion ETF outflow streak started on May 11, not on May 15.)
Cryptocurrency metrics FAQs
The developer or creator of each cryptocurrency decides on the total number of tokens that can be minted or issued. Only a certain number of these assets can be minted by mining, staking or other mechanisms. This is defined by the algorithm of the underlying blockchain technology. On the other hand, circulating supply can also be decreased via actions such as burning tokens, or mistakenly sending assets to addresses of other incompatible blockchains.
Market capitalization is the result of multiplying the circulating supply of a certain asset by the asset’s current market value.
Trading volume refers to the total number of tokens for a specific asset that has been transacted or exchanged between buyers and sellers within set trading hours, for example, 24 hours. It is used to gauge market sentiment, this metric combines all volumes on centralized exchanges and decentralized exchanges. Increasing trading volume often denotes the demand for a certain asset as more people are buying and selling the cryptocurrency.
Funding rates are a concept designed to encourage traders to take positions and ensure perpetual contract prices match spot markets. It defines a mechanism by exchanges to ensure that future prices and index prices periodic payments regularly converge. When the funding rate is positive, the price of the perpetual contract is higher than the mark price. This means traders who are bullish and have opened long positions pay traders who are in short positions. On the other hand, a negative funding rate means perpetual prices are below the mark price, and hence traders with short positions pay traders who have opened long positions.
Author

Vishal Dixit
FXStreet
Vishal Dixit holds a B.Sc. in Chemistry from Wilson College but found his true calling in the world of crypto.



