Bitcoin volatility falls to eight-month low: Is a BTC breakout imminent?


Key takeaways
- Bitcoin's implied volatility plunged to a multi-month low, signaling that traders expect further price consolidation.
- Excessive confidence among Bitcoin bears could catalyze a liquidation-driven bull run above $82,000.
Bitcoin (BTC) implied volatility dropped to 36%, its lowest level in eight months, signaling that professional traders are pricing in lower odds of wide price swings. While declining volatility is not inherently bullish or bearish, Bitcoin derivatives data suggest that overconfidence among bears could catalyze a bullish breakout.
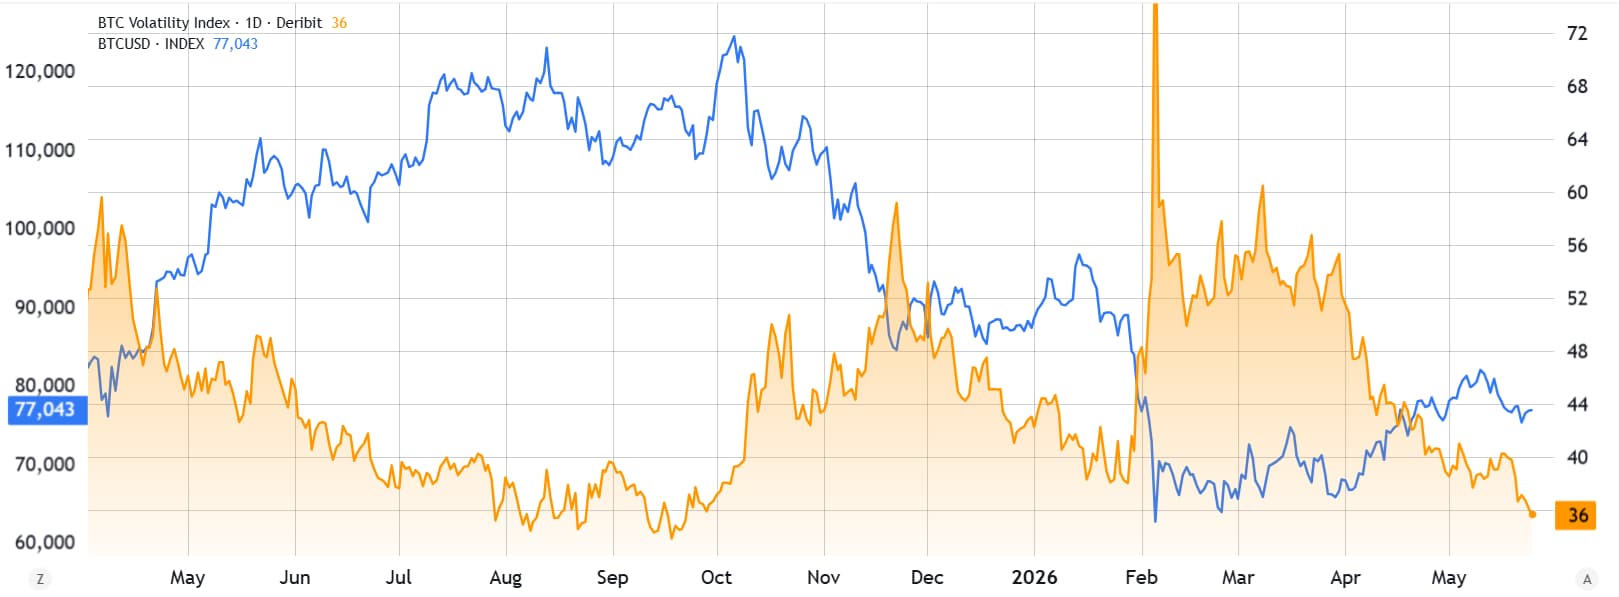
Bitcoin/USD (blue) vs. Deribit Bitcoin volatility index (orange). Source: TradingView
A sharp price decline between January and February caused an initial spike in volatility, especially due to the lack of a clear rationale for the move. Even as Bitcoin traded in a relatively narrow range between $63,000 and $71,000 in March, implied volatility held above 50%.
Traders became increasingly confident in the support level near $60,000, leading to a lower risk perception and a subsequent reduction in volatility. Some analysts claim the Bitcoin price has been tamed due to growing institutional participation and the expansion of derivatives products, including Strategy’s perpetual stocks.

Source: X/Nakamoto
Tyler Evans, chief investment officer of UTXO Management, reportedly said that digital credit products created a buffer against Bitcoin’s volatility. Rather than being forced to sell their holdings, large investors—including miners and companies focused on building Bitcoin reserves—have increasingly resorted to collateralized loans.
Is Bitcoin volatility bound to go up?
Bitcoin’s volatility may return to levels above 42%, as the asset is far from mature in terms of adoption and potential use cases. Bitcoin’s volatility has never held below 35%, but in theory, it could go lower. Historically, major price swings occur after a period of consolidation, which results in lower volatility.
Regardless of whether it is driven by external factors such as trade wars, economic stimulus measures, or excessive stock market valuations, Bitcoin’s price moves are often accelerated by liquidations of leveraged positions.
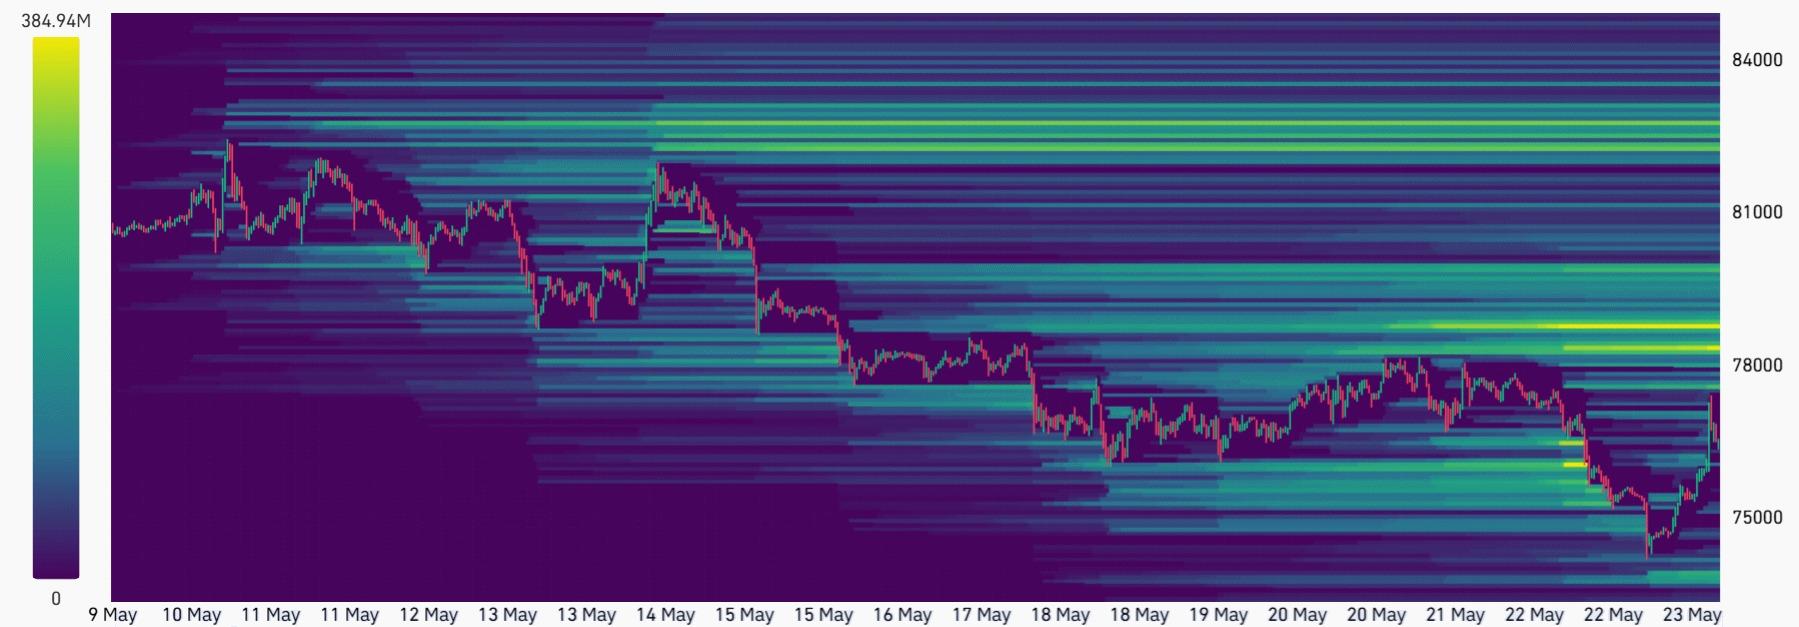
Estimated Bitcoin liquidation heatmap, USD. Source: CoinGlass
Bitcoin liquidation heatmap estimates show a high concentration of shorts (sell positions) between $78,000 and $83,000. Bears might have become overconfident after nearly four months of the Bitcoin price holding below $90,000. The Bitcoin options skew can be helpful to assess how whales and market makers are positioned.
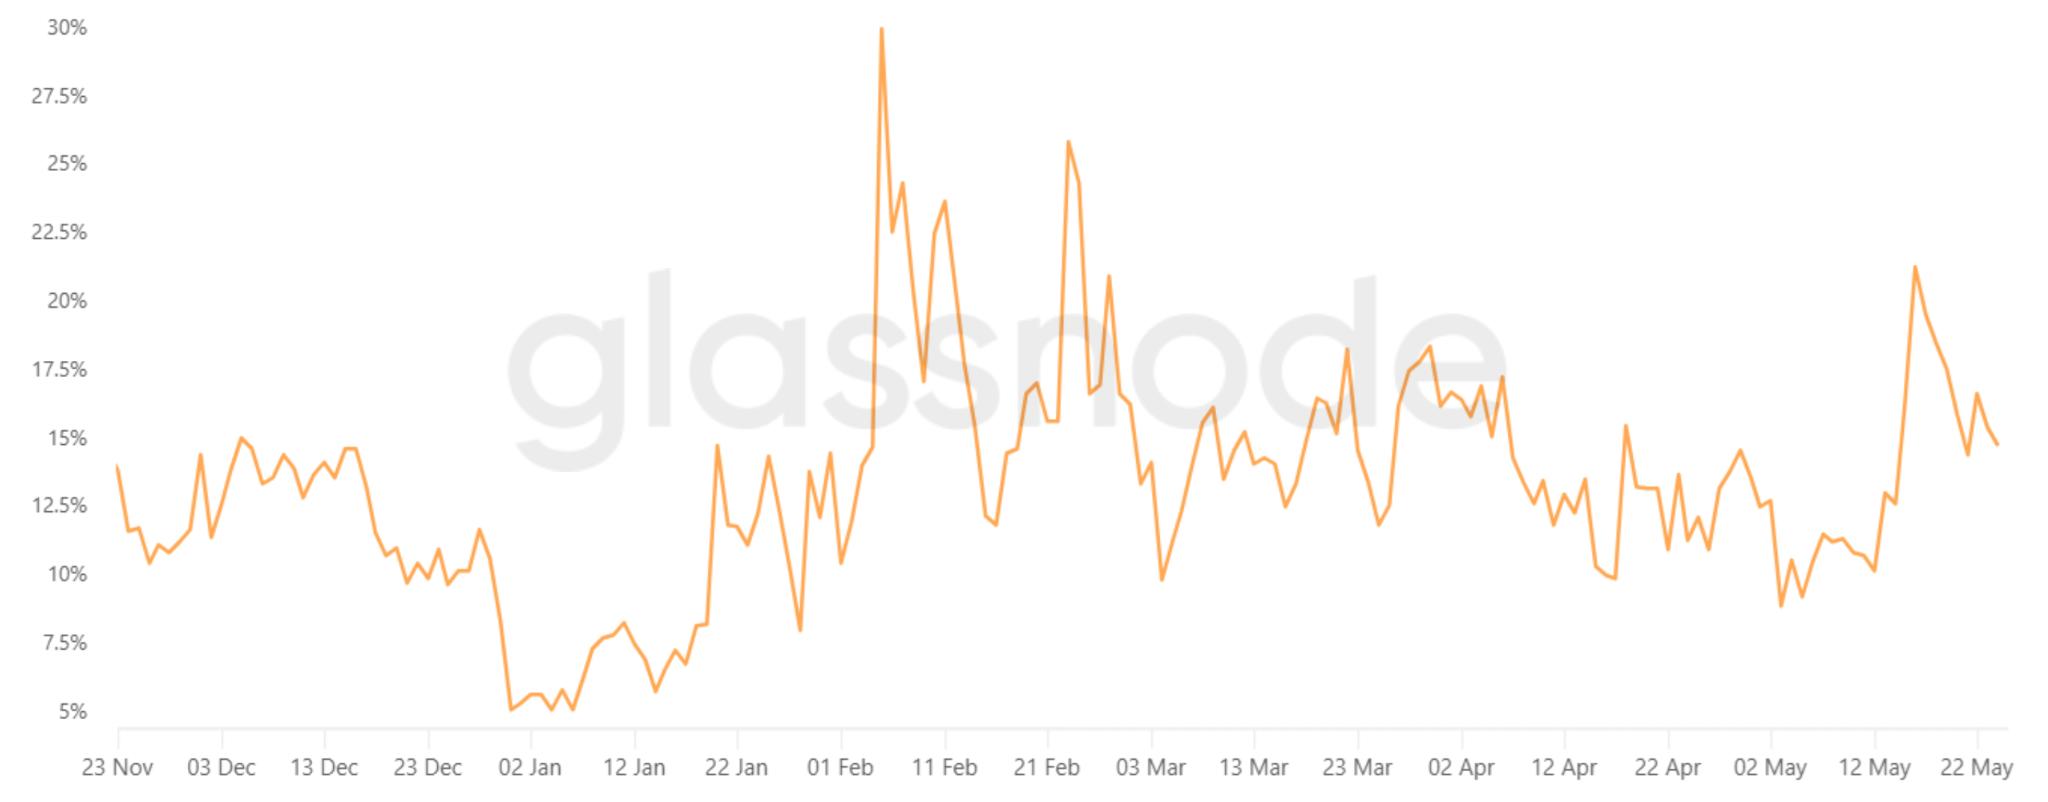
Bitcoin 30-day options delta skew (put-call). Source: Glassnode
Professional traders currently fear a Bitcoin price decline as put (sell) options trade at a 14% premium relative to call (buy) instruments. Under neutral market conditions, this indicator should range between -6% and +6%, but this has not been the case over the past four months.
Volatility should not be used to predict market direction. However, given the weak sentiment in Bitcoin options markets, odds are that a bullish breakout above $82,000 would trigger a stronger squeeze in leveraged positions, while a retest of $72,000 seems somewhat priced in.
Author
Cointelegraph Team
Cointelegraph
We are privileged enough to work with the best and brightest in Bitcoin.