Bitcoin Technical Analysis: BTC/USD upside momentum burns out
- Bitcoin price on Thursday trading down marginally by just 1%, with lack of commitment still from either camp.
- Rallies continue to be unsustainable, as bulls lose momentum after the run on Wednesday.

Spot rate: 3396.20
Relative change: -1.05%
High: 3413.72
Low: 3337.73
Trend: Bearish
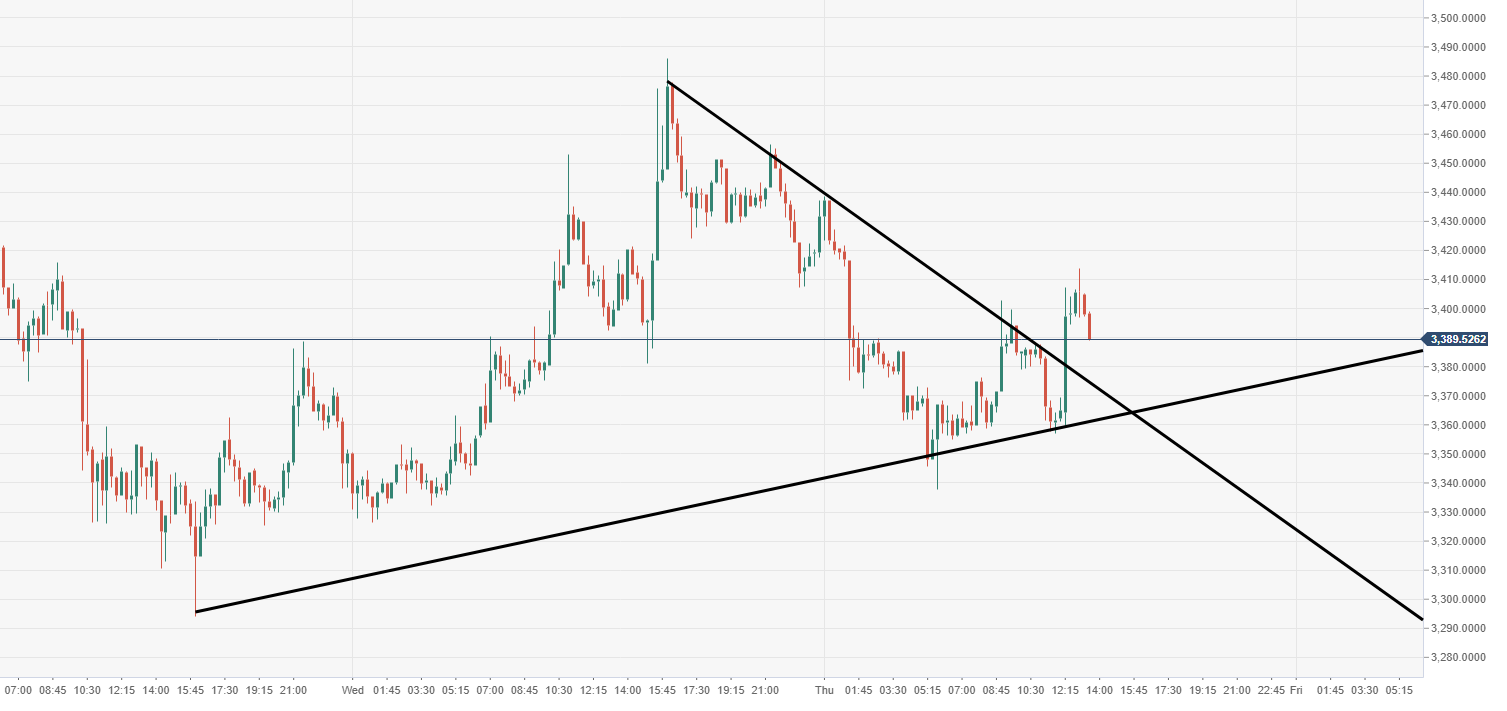
Support 1: 3374.73, breached descending trend line.
Support 2: 3343.3, daily pivot point support.
Support 3: 3254.82, daily pivot point support.
Resistance 1: 3503.23, daily pivot point resistance.
Resistance 2: 3574.69, daily pivot point resistance.
Resistance 3: 3663.17, daily pivot point resistance.
BTC/USD 60-minute chart
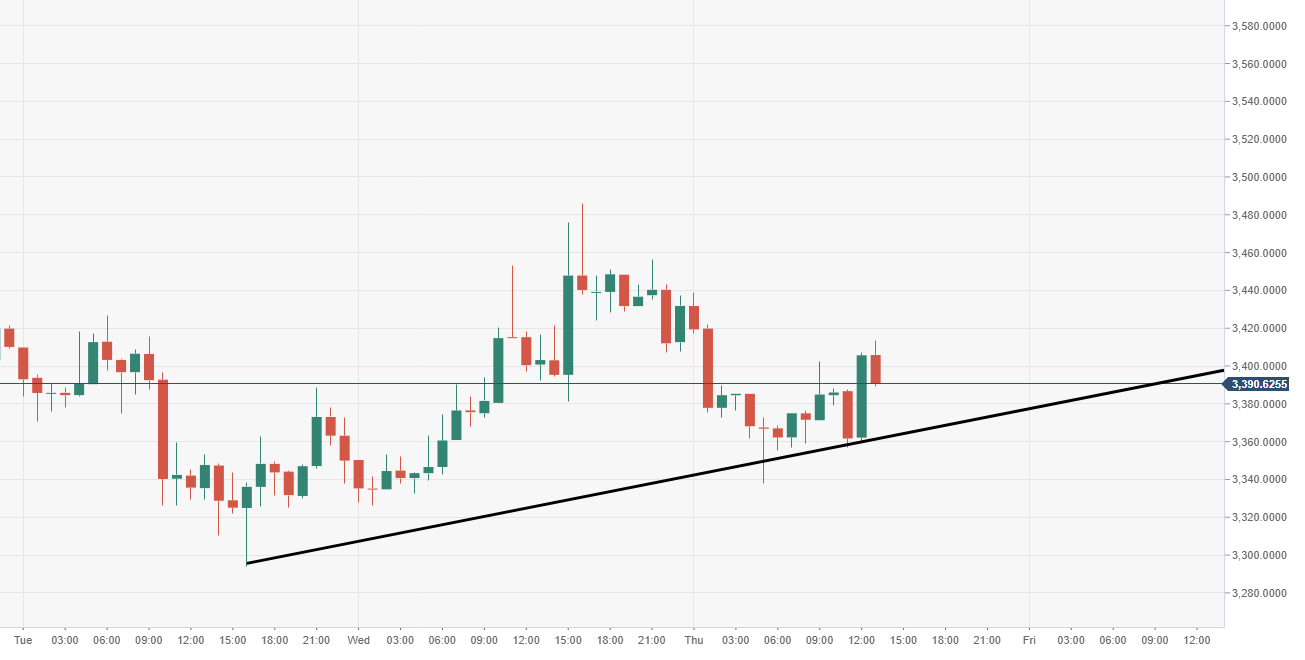
- Price cushioned for now by a near-term ascending trend line, preventing a breakout to the downside.
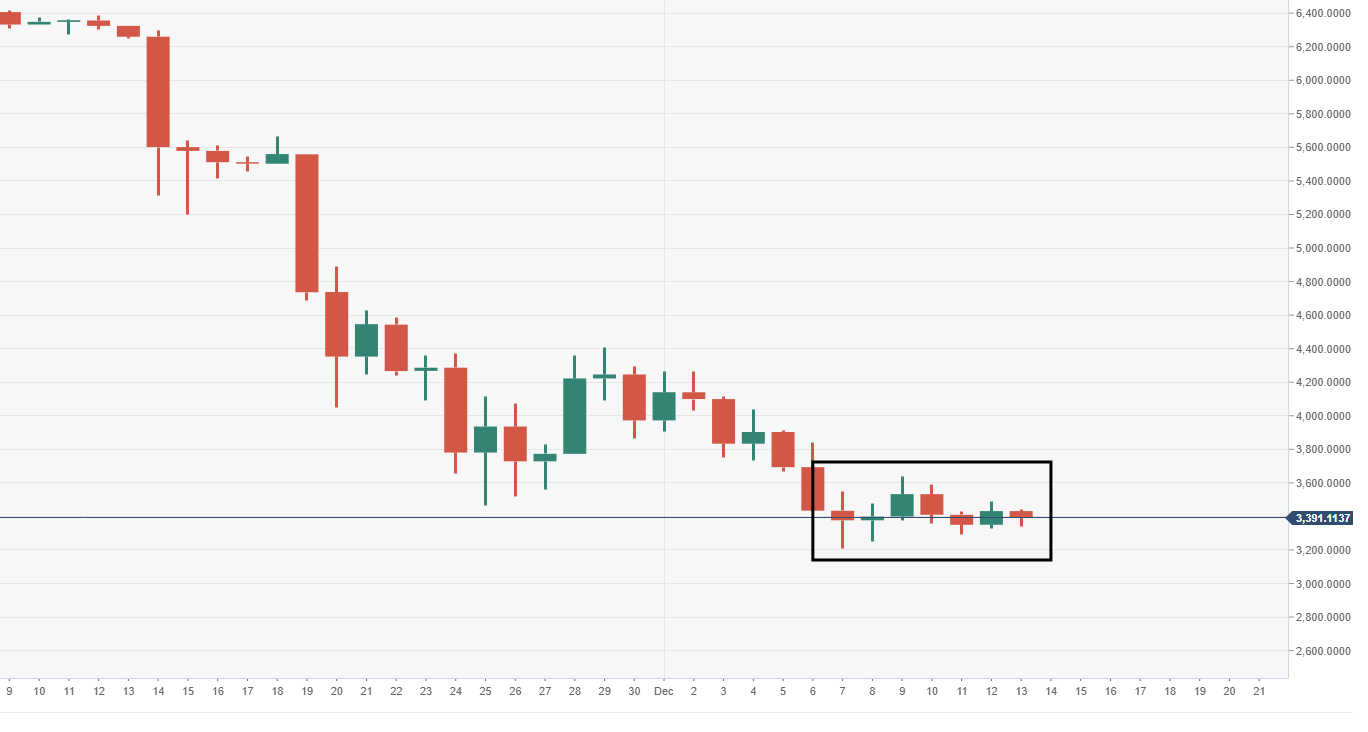
BTC/USD daily chart
- Lack of committed direction, as price trades within range block, vulnerable to downside risks.
Author

Ken Chigbo
Independent Analyst
Ken has over 8 years exposure to the financial markets. He started his career as an analyst, covering a variety of asset classes; forex, fixed income, commodities and equities.


