Bitcoin Elliott Wave technical analysis [Video]
![Bitcoin Elliott Wave technical analysis [Video]](https://editorial.fxstreet.com/images/Markets/Currencies/Digital Currencies/Bitcoin/bitcoin_closer.jpg)
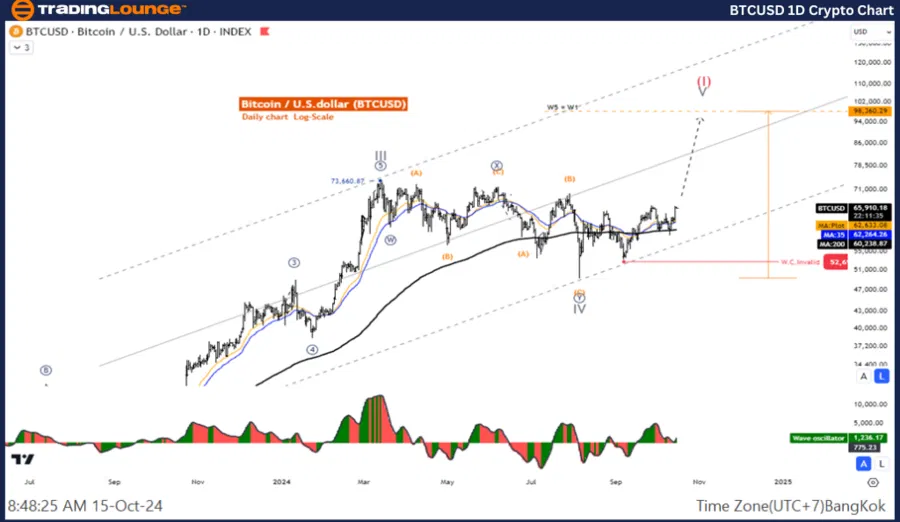
Elliott Wave Analysis TradingLounge daily chart
BTC/USD Elliott Wave technical analysis
Function: Counter Trend.
Mode: Corrective.
Structure: Double Corrective.
Position: Wave ((Y)).
Direction next higher degrees: Wave IV.
Details: The decline of wave IV is likely to end and the price is re-entering the uptrend.
Bitcoin/ U.S. dollar (BTCUSD) Trading Strategy: It looks like the wave IV correction is complete and the price is still likely to move up. Look for an opportunity to join the wave V uptrend.
Bitcoin/ U.S. dollar (BTCUSD) Technical Indicators: The price is above the MA200 indicating an uptrend, The Wave Oscillator is a Bearish Momentum.
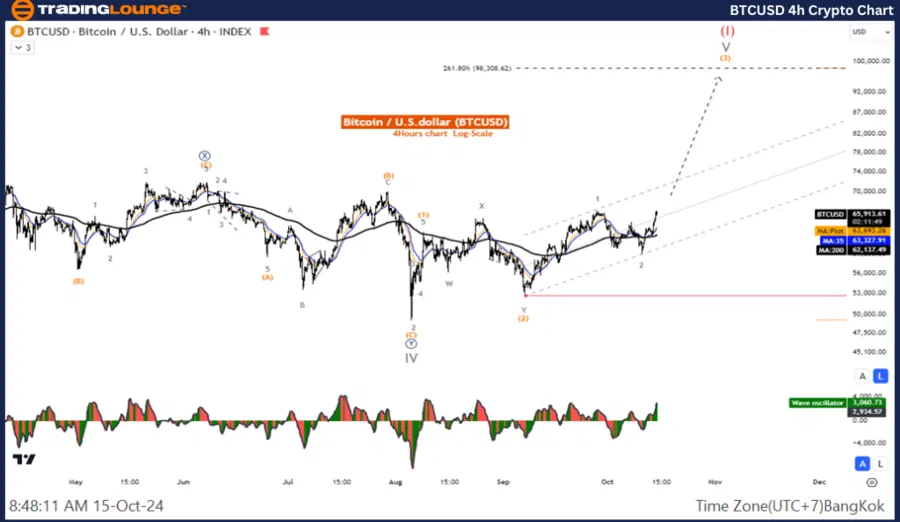
BTC/USD Elliott Wave technical analysis
Function: Counter Trend
Mode: Corrective
Structure: Double Corrective
Position: Wave ((Y))
Direction next higher degrees: Wave (2)
Details: Wave (2) is likely to end and the price is re-entering the uptrend.
Bitcoin/ U.S. dollar (BTCUSD) Trading Strategy: It looks like the wave (2) correction is complete and the price is still likely to move up. Look for an opportunity to join the wave (3) uptrend.
Bitcoin/ U.S. dollar (BTCUSD) Technical Indicators: The price is above the MA200 indicating an uptrend, The Wave Oscillator is a Bearish Momentum.
Bitcoin Elliott Wave technical analysis [Video]
Author

Peter Mathers
TradingLounge
Peter Mathers started actively trading in 1982. He began his career at Hoei and Shoin, a Japanese futures trading company.


