|

Bitcoin Elliott Wave analysis: Corrective bounce or bullish breakout? [Video]

Bitcoin continues to display an incomplete bearish sequence from the October 6 peak, which suggests that further downside remains possible. The extreme target zone derived from that peak lies between $41,411 and $52,204, and this area continues to serve as the broader downside objective. Despite this longer-term view, the cryptocurrency has been staging a corrective rally in the near term. From the February 6, 2026 low, Bitcoin has advanced in what appears to be a zigzag Elliott Wave structure, correcting the larger degree cycle that began from the January 14 peak.

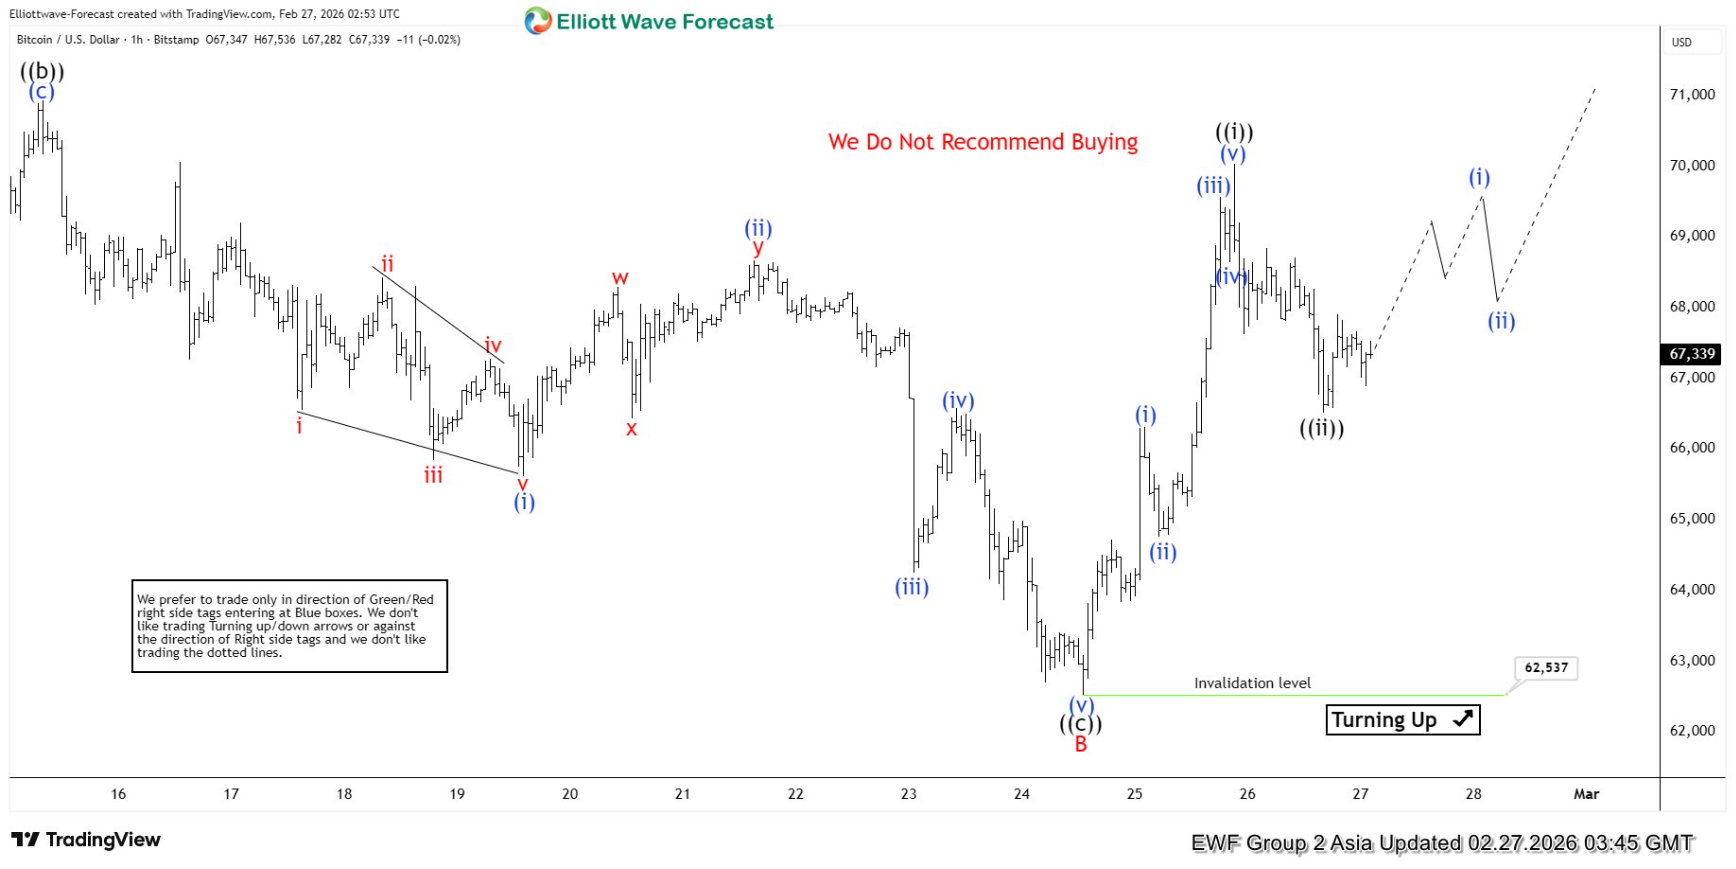
Within this corrective move, wave A concluded at $72,174, followed by a pullback in wave B that ended at $62,537. Since then, price action has turned higher again in wave C. The internal subdivision of wave C is unfolding as a five-wave impulse, which provides a clearer framework for short-term expectations. From the wave B low, wave ((i)) finished at $70,038, while the subsequent dip in wave ((ii)) found support at $67,556. The market has since resumed its upward trajectory, reinforcing the view that wave C remains in progress.

As long as the pivot at $62,537 holds, Bitcoin is expected to extend higher in the near term. This corrective rally does not yet invalidate the broader bearish sequence, but it highlights the potential for continued strength before the larger trend resumes. Traders should monitor the unfolding impulse closely, as the completion of wave C will provide important clues regarding whether the rally is merely corrective or the beginning of a more sustained bullish trend.

Bitcoin one-hour Elliott Wave chart from 2.25.2026
BTC/USD Elliott Wave [Video]

Youtube preview

Author

Elliott Wave Forecast Team

Elliott Wave Forecast Team

ElliottWave-Forecast.com

More from Elliott Wave Forecast Team
Share:

Editor's Picks

Bitcoin Weekly Forecast: BTC retreats as macro headwinds grow
Bitcoin (BTC) remains under pressure, down over 4% this week and trading around $76,900 at the time of writing on Friday. Institutional demand shows signs of weakness as spot BTC Exchange Traded Funds (ETFs) are on track to end their three-week inflow streak, recording nearly $500 million in net outflows through Thursday.
XRP falls toward key support as macro uncertainty, weak momentum cap recovery
Ripple (XRP) falls below $1.33 on Friday, marking the third consecutive day of declines. The token continues to track the broader cryptocurrency market downturn, with investors closely monitoring heightened macroeconomic uncertainty ahead of the United States (US) Consumer Price Index (CPI) release and next week’s Federal Reserve (Fed) monetary policy decision.
Crypto Today: Bitcoin, Ethereum, XRP stabilize at lower levels amid ETF outflows and macroeconomic risks
The broader cryptocurrency market is rising on Friday, with Bitcoin (BTC) trading above $77,000 after testing lower support near $76,500. Ethereum (ETH) shows signs of stability, hovering above the support provided at $2,400 despite capped upside at $2,500. Meanwhile, Ripple (XRP) holds above $1.33 after three straight days of declines, reflecting growing headwinds due to macroeconomic uncertainty.
Bitcoin pulls back as another golden cross fails to deliver
Earlier this week, Bitcoin formed a golden cross, a technical signal that occurs when the price’s 50-day moving average rises above the 200-day moving average and is conventionally viewed as a precursor to a bullish rally. Historically, however, that’s often not been the case.
Bitcoin: BTC retreats as macro headwinds grow
Bitcoin (BTC) remains under pressure, down over 4% this week and trading around $76,900 at the time of writing on Friday. Institutional demand shows signs of weakness as spot BTC Exchange Traded Funds (ETFs) are on track to end their three-week inflow streak, recording nearly $500 million in net outflows through Thursday.

