Bitcoin bulls not retreating after reaching all-time high
-
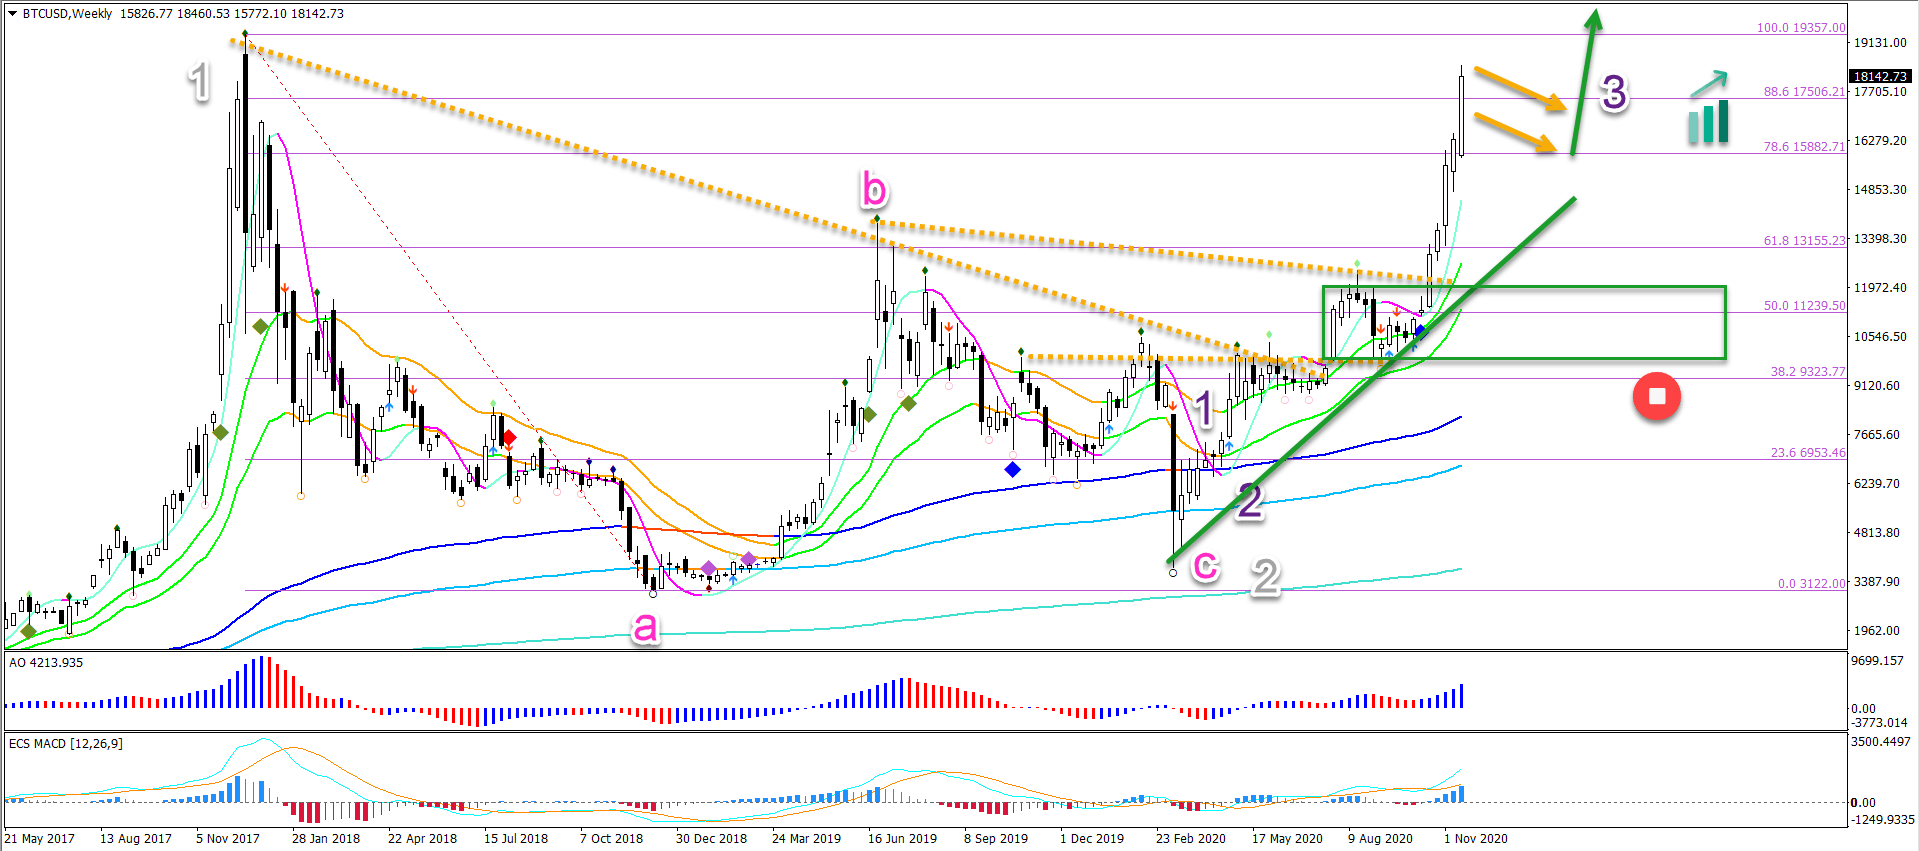
Bitcoin (BTC/USD) is showing massive bullish momentum as expected in earlier analysis. Price action is moving away from the 21 ema zone without hesitation..
-
BTC/USD rocket has broken above the 78.6% and 88.6% Fibonacci retracement resistance levels. Price action will probably test the previous top and all time high soon.

Bitcoin (BTC/USD) is showing massive bullish momentum as expected in earlier analysis. Price action is moving away from the 21 ema zone without any hesitation.Will price action continue or will there be a pauze?
Price Charts and Technical Analysis
The BTC/USD rocket has broken above the 78.6% and 88.6% Fibonacci retracement resistance levels. Price action will probably test the previous top and all time high soon.
But the top is likely to stop price action for a little while:
-
Some minor bearish pullback is expected as bulls take profit.
-
The retracement will probably create a bull flag chart pattern (orange arrows).
-
An immediate breakout above the top without a flag indicates very strong bullish momentum.
- If a flag pattern does appear on the 4 hour or daily chart (does not have to be a weekly chart), then a bullish breakout is expected.
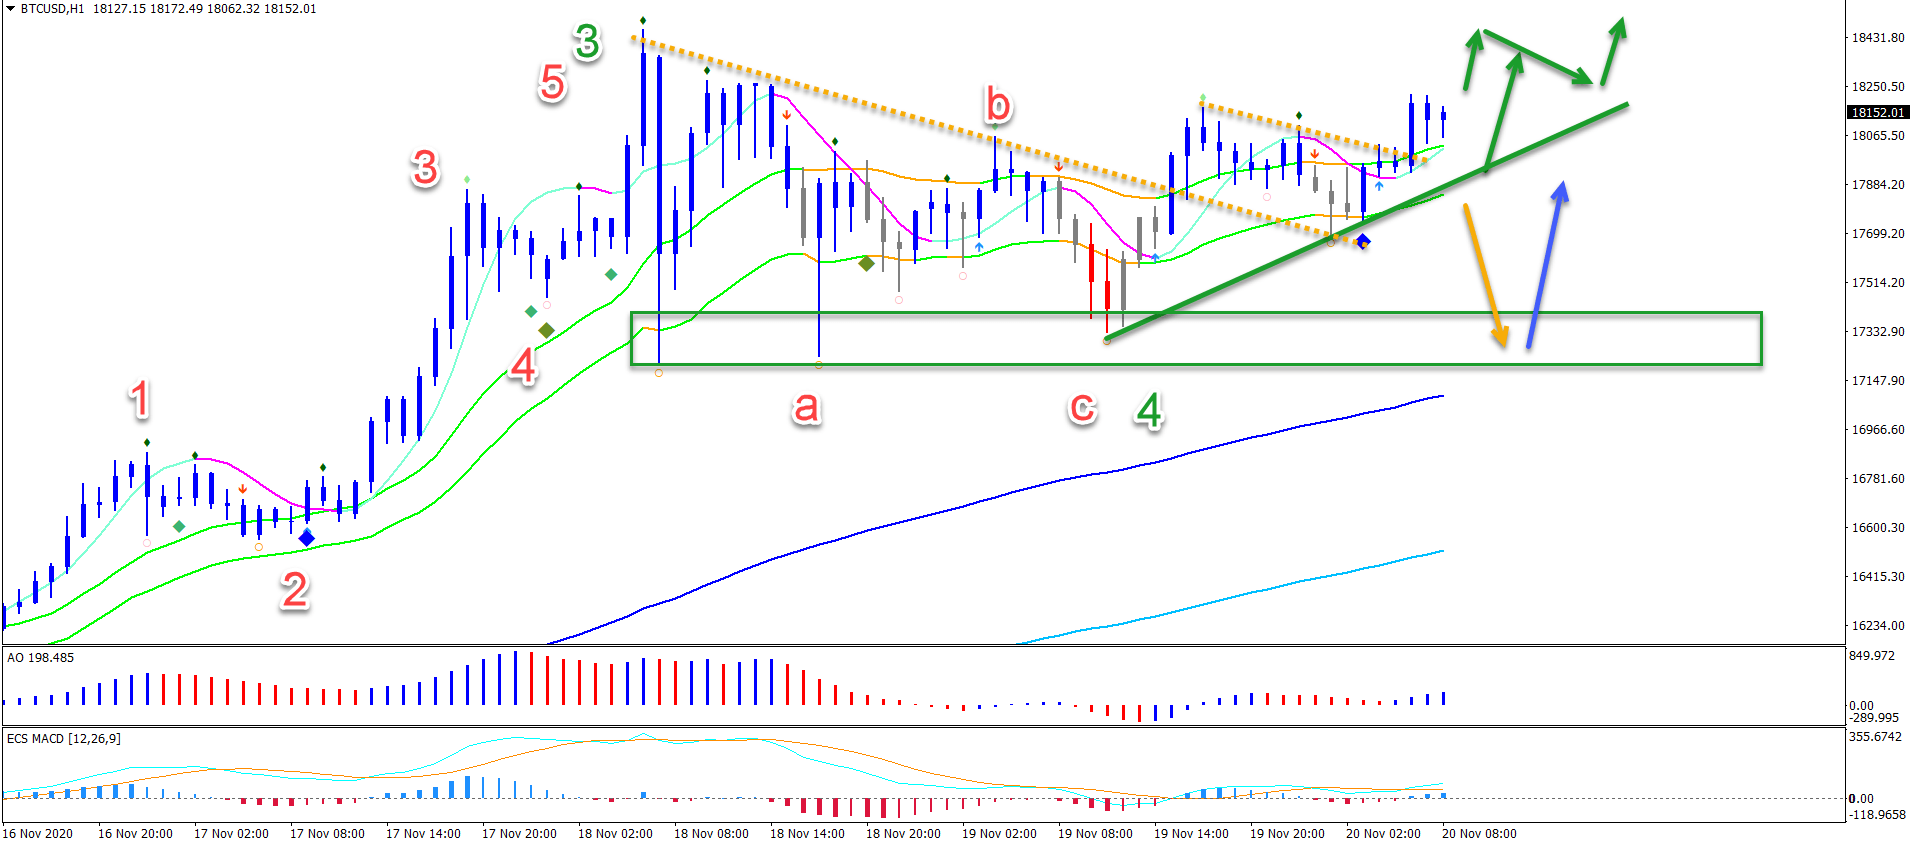
On the 1 hour chart, price action is moving sideways. This seems to be an ABC (red) pattern in wave 4 (green).
Price action broke above the 21 ema zone and used it as a bouncing spot. Now the price is above the 21 ema. A breakout above the Fractal could indicate an immediate upside (green arrow).
A bearish breakout below the 21 ema, however, could indicate a deeper retracement (orange arrow). This could indicate an extended wave 4 (green).
The analysis has been done with the ecs.SWAT method and ebook.
Author

Chris Svorcik
FS method
Chris Svorcik is a trader, analyst, and educator with over 15 years of experience in financial markets, specializing in moving averages, market structure, and price patterns.


