Bitcoin Bollinger Bands push key breakout as creator acts on positive signal

Bitcoin (BTC) is attempting its first Bollinger Bands breakout in months, while creator John Bollinger is more bullish than some traders.
Key points
- Bitcoin faces stiff resistance as it attempts daily candle closes above the upper Bollinger Band.
- Volatility comes on cue after the Bands' tightest-ever conditions last month.
- Creator John Bollinger takes advantage of positive trading signals as part of his investment program.
Responses mixed as Bitcoin tests Bollinger Bands ceiling
Data from TradingView confirms that on Wednesday, BTC/USD saw its second daily close above the upper Bollinger Band on the daily chart, something it has not achieved since mid-January.
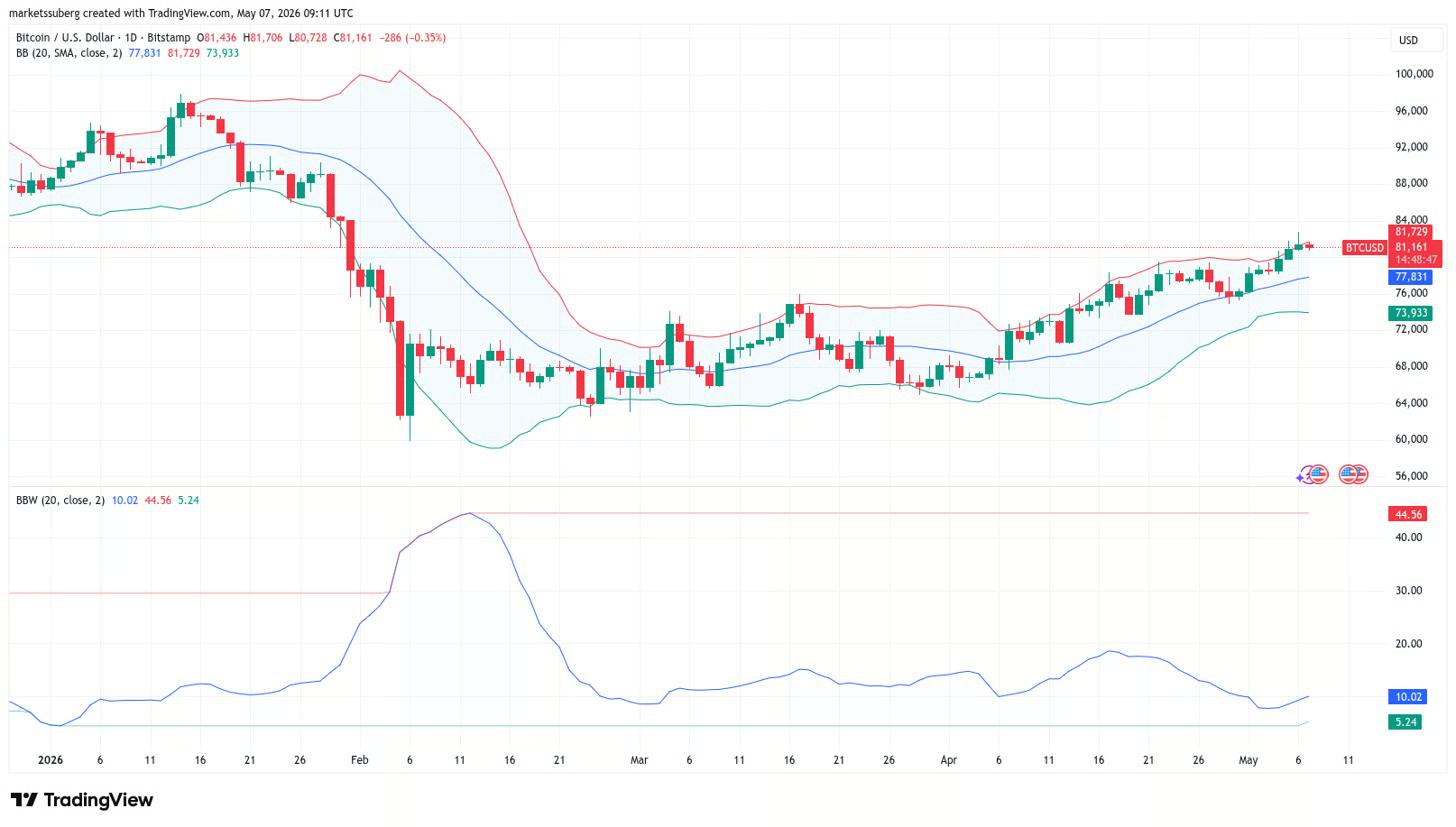
The Bollinger Bands indicator, used to assess both volatility and momentum, recently saw the narrowest gap between its constituent trend lines ever recorded for Bitcoin.
This led to predictions of a breakout move, with the direction open to debate, as well as heightened volatility to come.
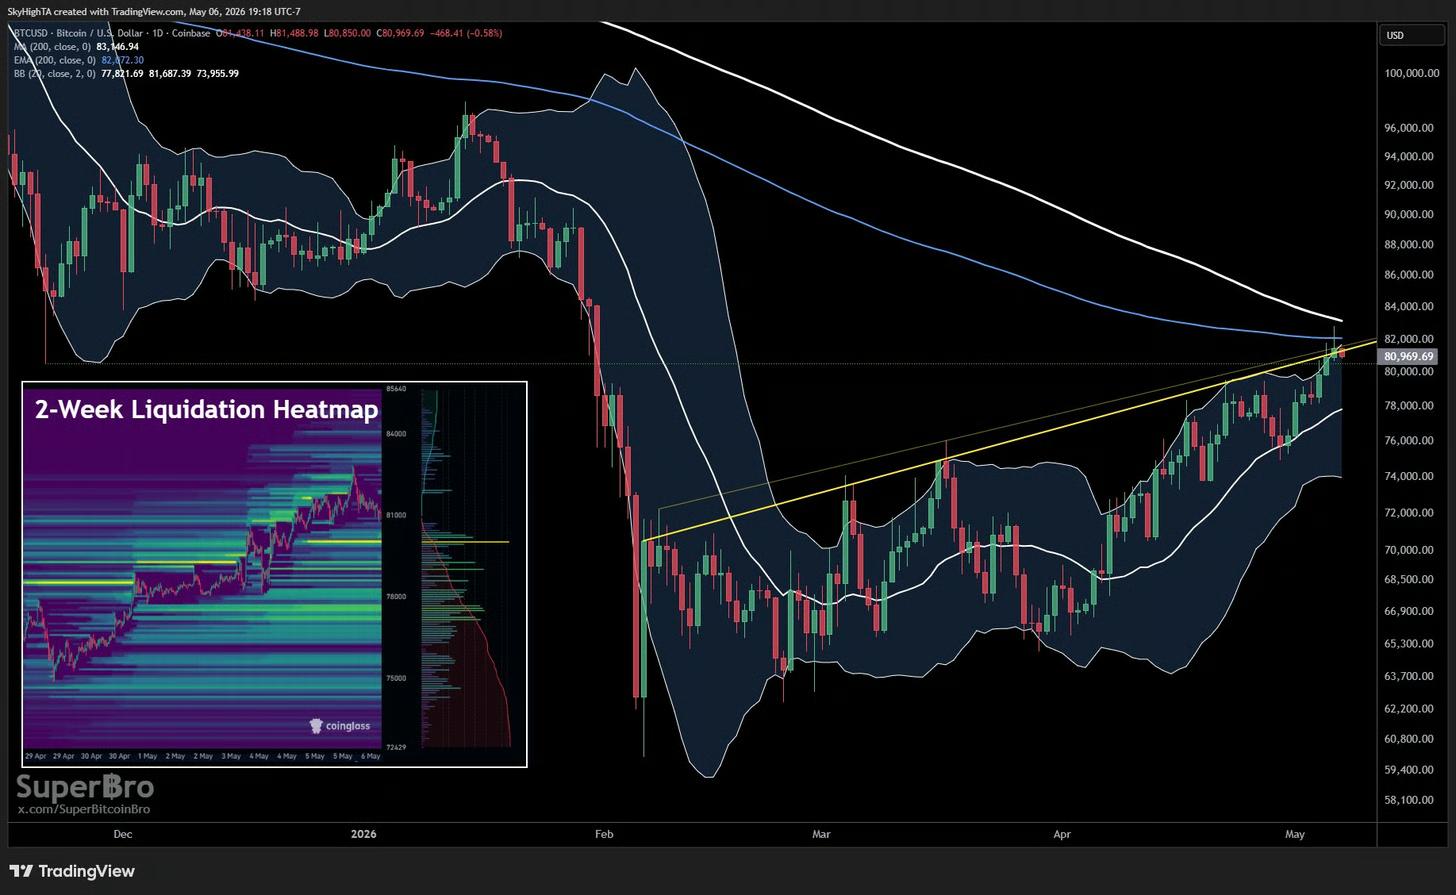
Commenting on the visit to the upper band, however, trader SuperBro noted that the price was now in an area full of potential points of rejection.
“Closed above the upper Bollinger Band, above the trendline on closing prices, but just below the log trendline on wicks,” they wrote in a post on X.
SuperBro added that most potential liquidations now belonged to long positions below the price, with shorts already taken out.
“There are relatively few short liquidations remaining up to 85K compared to long liquidations down to 74K,” they continued.
However, bulls still have the momentum advantage and I don't yet see a good reversal setup. Despite the liquidation imbalance, I'm holding tight to see if we can blast through.
Bollinger, the indicator’s creator, revealed that one of his investment fund’s proprietary trading models had flipped positive on Bitcoin, and had taken a position accordingly.
"Overheated" Bollinger signal returns after 18 months
Wednesday also saw another Bollinger Band milestone, this time concerning the market value to realized value (MVRV) ratio for speculative investors.
The metric, recently covered by Cointelegraph, compares Bitcoin’s market cap to the price at which the supply last moved, also known as its “realized cap.”
A Bollinger Bands derivative entered “overheated” territory for the first time since late 2024, the X analytics account Frank Fetter noted.
At the time, BTC/USD was building its first visit to $100,000 in history.
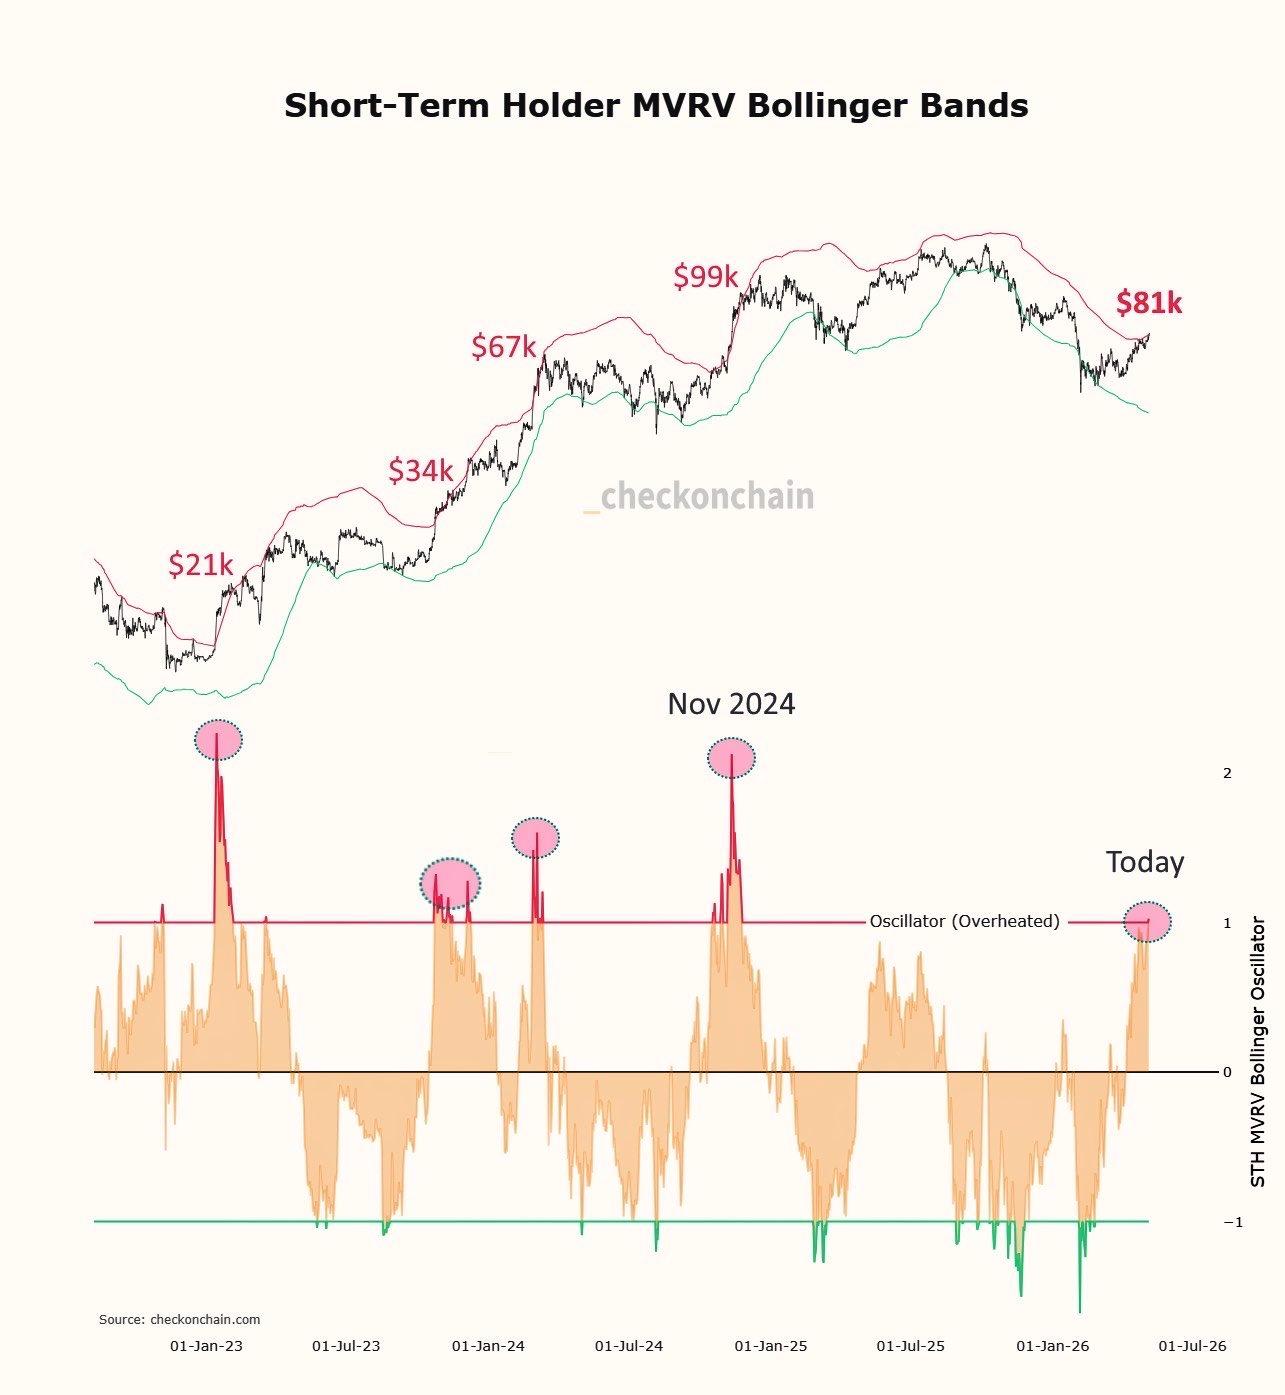
Asked whether “overheated” conditions implied a price reversal, the account said this was “not necessarily” a given outcome.
Author

Cointelegraph Team
Cointelegraph
We are privileged enough to work with the best and brightest in Bitcoin.


