Ripple and Stellar outlook: Rebound from key technical supports as derivatives turn mildly bullish
- XRP recovers slightly on Tuesday after dropping toward the key EMA clusters the previous day.
- XLM rebounds modestly, finding support around the ascending trendline.
- Mixed derivatives metrics with a slight bullish tilt support a recovery for both altcoins.

Ripple (XRP) and Stellar (XLM) rebound slightly on Tuesday, trading above $1.359 and $0.191, respectively, following a correction the previous day. Both XRP and XLM now test key support levels, with improving derivatives metrics supporting their recovery.
Derivatives metrics support a mild bullish bias
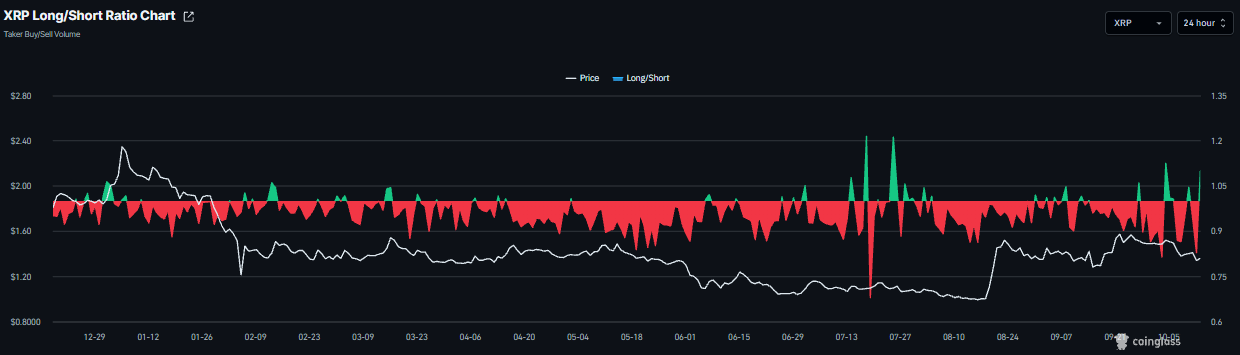
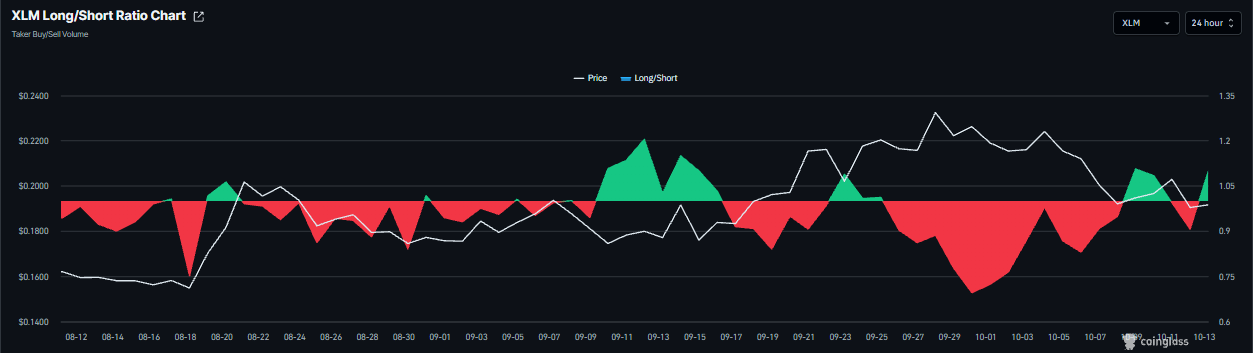
Derivatives data shows improving conditions for Ripple and Stellar. CoinGlass’ long-to-short ratios for XRP and XLM read 1.09 and 1.08, respectively, on Tuesday. A ratio above one indicates bullish sentiment, as traders bet that asset prices will rise.
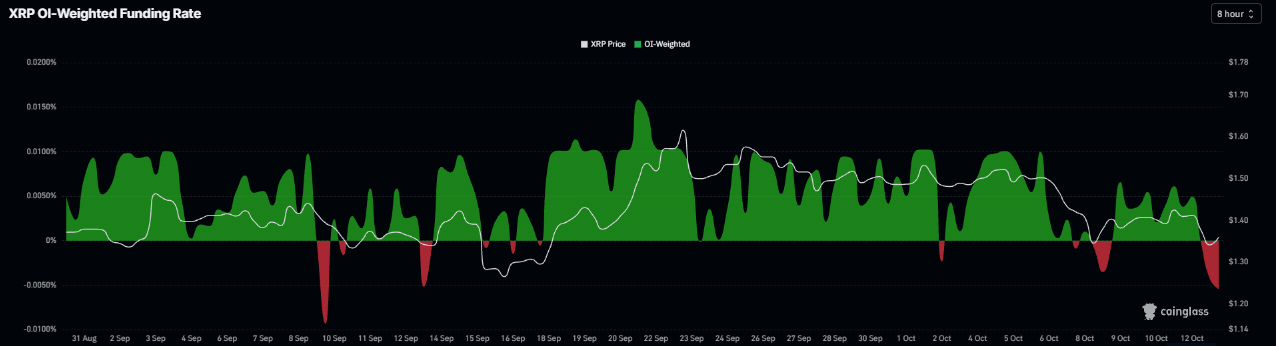
Meanwhile, XRP funding rates flipped negative on Monday, reading -0.0055% on Tuesday, indicating shorts are paying longs and suggesting a cautious outlook.
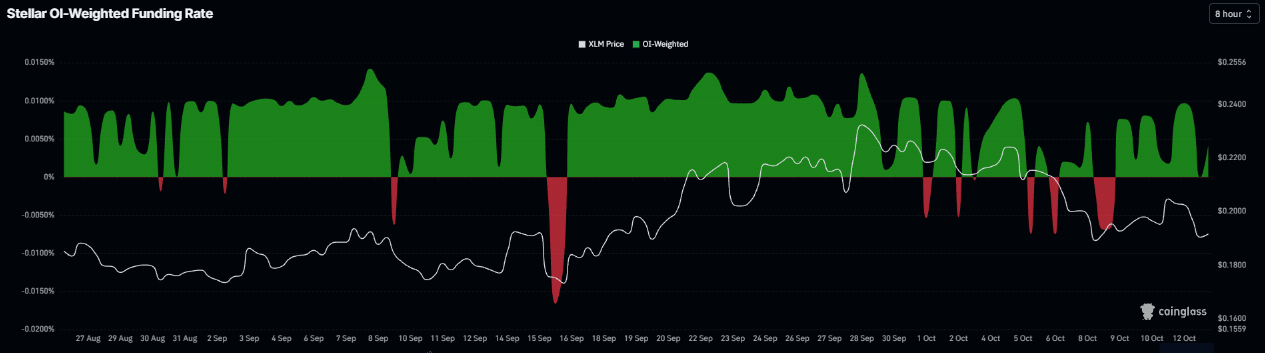
However, XLM funding rates flipped positive on Monday, reading 0.0042% on Tuesday, indicating longs are paying shorts and suggesting a bullish outlook.
XRP technical outlook: Slips below key EMAs
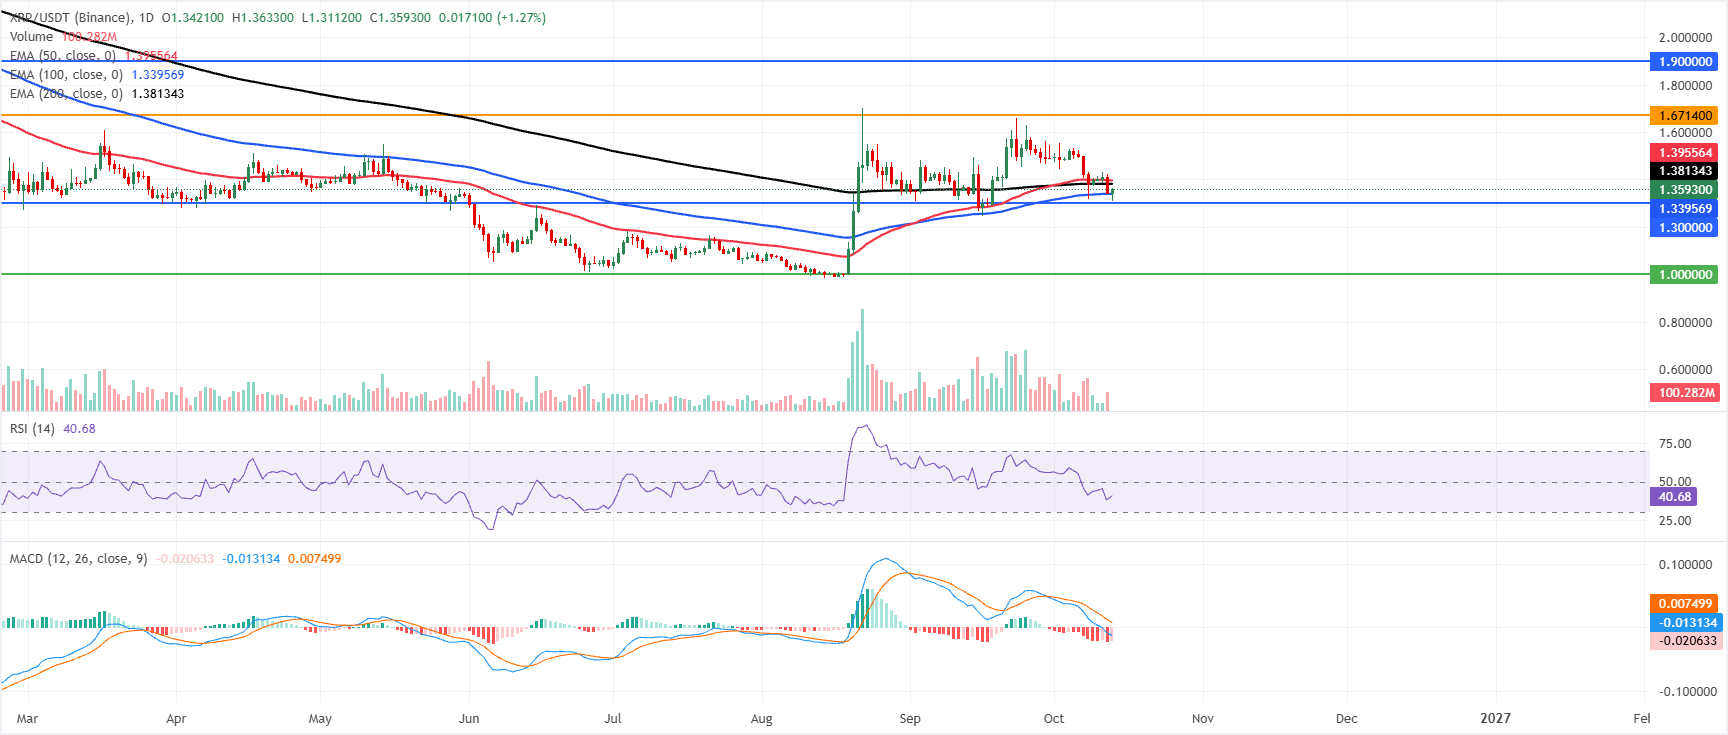
XRP price trades at $1.359 on Tuesday, holding below the 200-day Exponential Moving Average (EMA) at $1.381 and the 50-day EMA at $1.395, which keeps the near-term bias bearish despite the price still hovering above the 100-day EMA at $1.339.
The Relative Strength Index (RSI) around 40 hints at subdued momentum rather than outright oversold conditions, while the Moving Average Convergence Divergence (MACD) remains in negative territory, reinforcing a downside-skewed tone as rallies struggle beneath the clustered EMA resistance overhead.
On the topside, initial resistance is seen at the 200-day EMA near $1.381, followed by the 50-day EMA at $1.395, with higher barriers at the horizontal levels of $1.671 and $1.900 that cap the broader range.
On the downside, immediate support is provided by the 100-day EMA at $1.339, ahead of the horizontal floor at $1.300; a sustained break below that area would expose the deeper structural support zone around $1.000.
XLM technical outlook: Finds support around key trendline
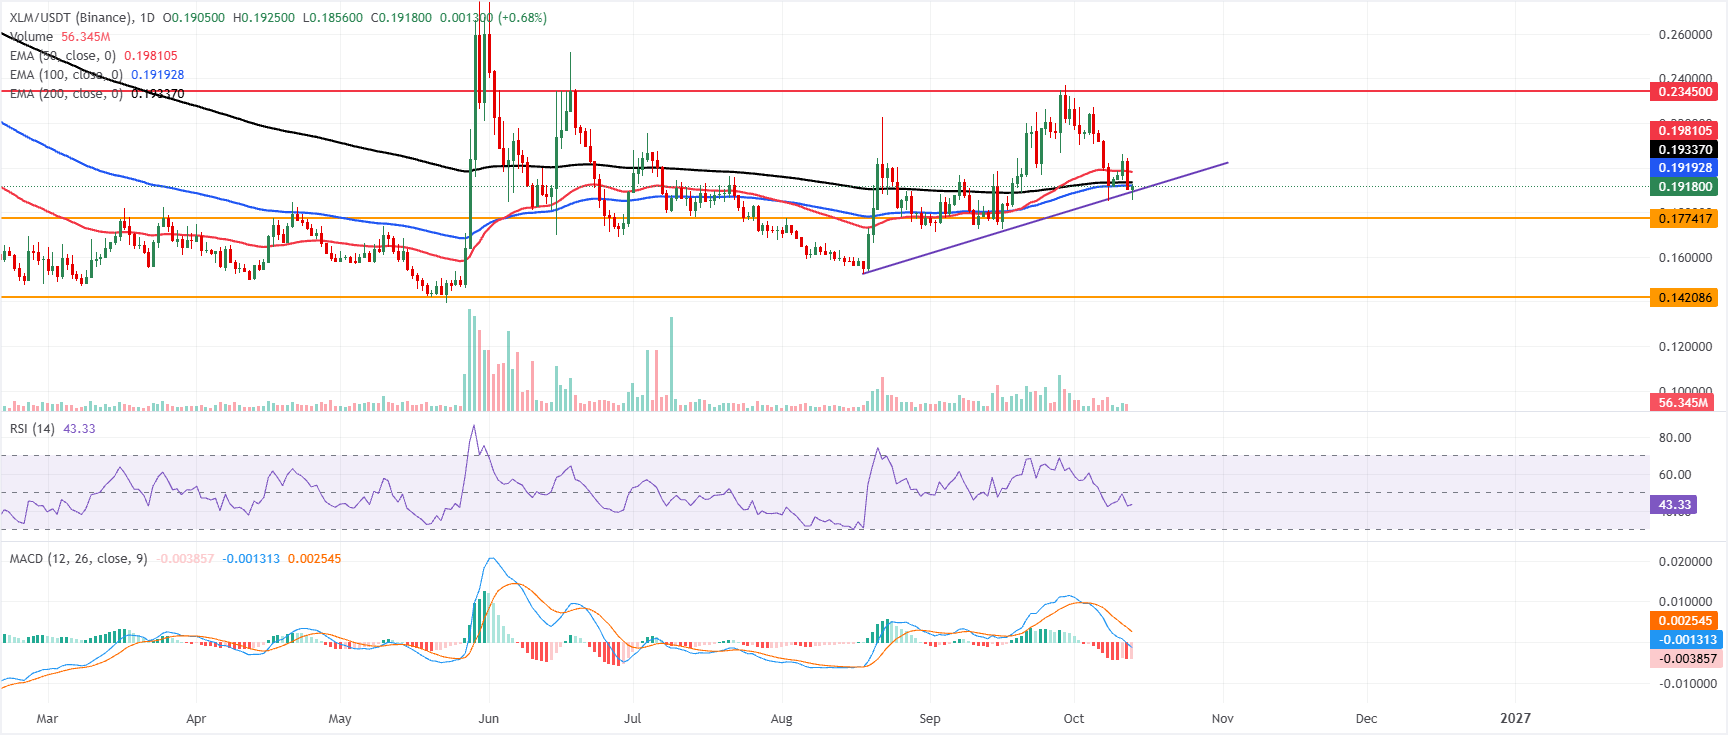
XLM price trades at $0.191 on Tuesday, capped by a dense band of EMA resistance just overhead. XLM sits fractionally beneath the 100-day EMA at $0.191 and the 200-day EMA at $0.193. In contrast, the 50-day EMA sits higher at $0.198, reinforcing a still-bearish near-term structure despite the pair holding above the rising trendline support around $0.189.
Momentum indicators echo this capped tone, with the RSI hovering near 43 and the MACD line extending below zero, hinting that sellers retain the upper hand unless the EMAs are reclaimed.
On the topside, initial resistance sits at the 100-day EMA at $0.191, followed by the 200-day EMA at $0.193; a decisive break above these levels would open the way to the 50-day EMA at $0.198 and, later, the horizontal barrier near $0.234.
On the downside, immediate support comes from the former trendline-break zone near $0.189, with deeper cushions at the horizontal levels of $0.177 and $0.142, where buyers would be expected to emerge if the current consolidation resolves lower.
(The technical analysis of this story was written with the help of an AI tool. Know more.)
Author

Manish Chhetri
FXStreet
Manish Chhetri is a crypto specialist with over four years of experience in the cryptocurrency industry.