Polkadot Price Forecast: DOT surges after dotUSD stablecoin launch
- Polkadot gains momentum and trades around $1.1800 on Friday as bulls return.
- Polkadot’s DAO-governed dotUSD has gone live on the protocol, promising a community-led stablecoin.
- DOT’s recovery builds on a robust technical structure, backed by the 50-day and 100-day EMAs.

Polkadot (DOT) maintains a short-term bullish outlook on Friday, approaching $1.1800 at the time of writing. The token is broadly supported by short-term and medium-term moving averages, underpinning a firm technical structure.
Nonetheless, investors should remain cautious, as significant supply persists near $1.1800. A decisive daily close above this threshold would further strengthen the bullish momentum.
Polkadot launches dotUSD stablecoin
Polkadot announced the launch of a new stablecoin, dotUSD, on Thursday, seeking to tap into the sector's $292 billion market capitalization. The network said dotUSD is fundamentally different from most leading stablecoins, which companies issue and control.
These companies, like banks, “decide who can hold them (stablecoins) and who can’t,” Polkadot said on X. DotUSD operates on a different premise, with no issuing company nor a single point of control. The stablecoin is governed by the DOT DAO through OpenGov. A DAO is a decentralized autonomous organization.

Technical analysis: Polkadot bulls tighten grip
Polkadot rises as buyers take on more risk against the backdrop of dotUSD launching. The token now trades at $1.1780, holding above the short- and medium-term Exponential Moving Averages (EMAs) but still capped by the longer-term 200-day EMA at $1.1864, which keeps the near-term bias mildly bearish despite the recent recovery.
The 50-day EMA at $1.0749 and the 100-day EMA at $1.0341 sit comfortably below price, suggesting an improving underlying trend, while the SuperTrend indicator at $0.9842 reinforces a broader support base. Momentum is mixed, as the Relative Strength Index (RSI) at 54 leans slightly positive, but the Moving Average Convergence Divergence (MACD) remains in negative territory, hinting that upside attempts could still face selling pressure while price trades beneath the 200-day EMA.
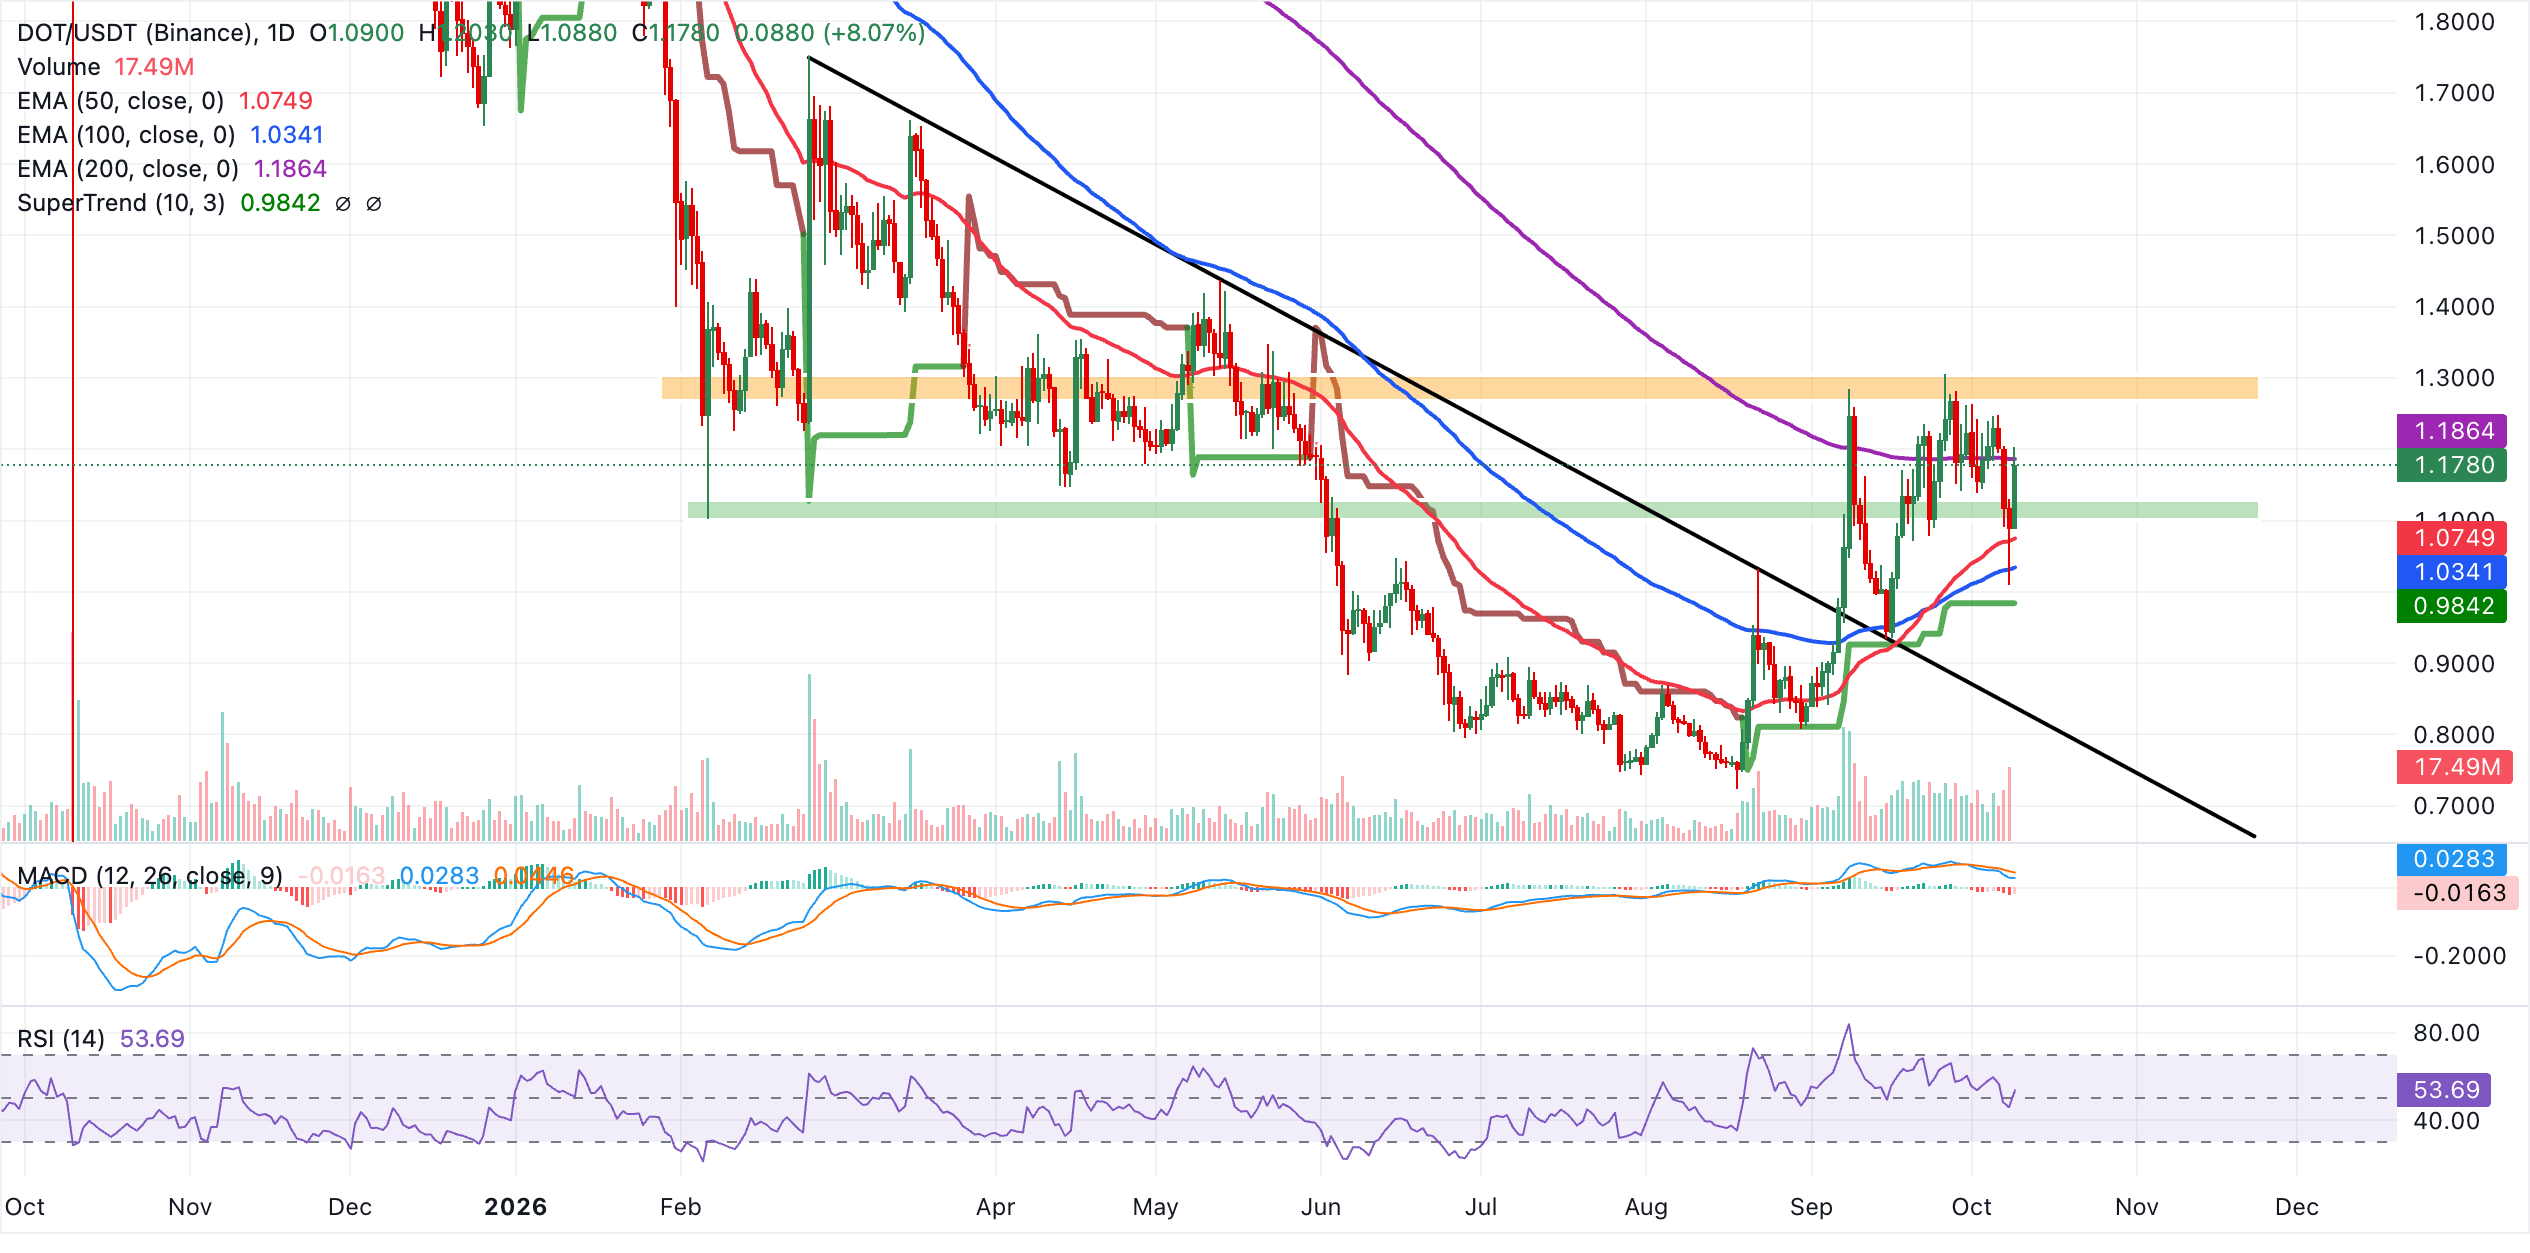
Initial resistance is defined by the 200-day EMA at $1.1864, and a daily close above this barrier would be needed to soften the prevailing bearish cap and open the way for a more sustained advance. On the downside, immediate support is located at the 50-day EMA at $1.0749, followed by the 100-day EMA at $1.0341, before a deeper corrective move could test the SuperTrend line near $0.9842, where buyers are likely to defend the broader bullish recovery structure.
(The technical analysis of this story was written with the help of an AI tool. Know more.)
Bitcoin, altcoins, stablecoins FAQs
Bitcoin is the largest cryptocurrency by market capitalization, a virtual currency designed to serve as money. This form of payment cannot be controlled by any one person, group, or entity, which eliminates the need for third-party participation during financial transactions.
Altcoins are any cryptocurrency apart from Bitcoin, but some also regard Ethereum as a non-altcoin because it is from these two cryptocurrencies that forking happens. If this is true, then Litecoin is the first altcoin, forked from the Bitcoin protocol and, therefore, an “improved” version of it.
Stablecoins are cryptocurrencies designed to have a stable price, with their value backed by a reserve of the asset it represents. To achieve this, the value of any one stablecoin is pegged to a commodity or financial instrument, such as the US Dollar (USD), with its supply regulated by an algorithm or demand. The main goal of stablecoins is to provide an on/off-ramp for investors willing to trade and invest in cryptocurrencies. Stablecoins also allow investors to store value since cryptocurrencies, in general, are subject to volatility.
Bitcoin dominance is the ratio of Bitcoin's market capitalization to the total market capitalization of all cryptocurrencies combined. It provides a clear picture of Bitcoin’s interest among investors. A high BTC dominance typically happens before and during a bull run, in which investors resort to investing in relatively stable and high market capitalization cryptocurrency like Bitcoin. A drop in BTC dominance usually means that investors are moving their capital and/or profits to altcoins in a quest for higher returns, which usually triggers an explosion of altcoin rallies.
Author

John Isige
FXStreet
John Isige is a seasoned cryptocurrency journalist and markets analyst committed to delivering high-quality, actionable insights tailored to traders, investors, and crypto enthusiasts. He enjoys deep dives into emerging Web3 tren




