Jupiter Price Forecast: JUP positions for a trend reversal as network activity picks up
- Jupiter is up 6% on Wednesday, crossing above its 200-day EMA at $0.2192.
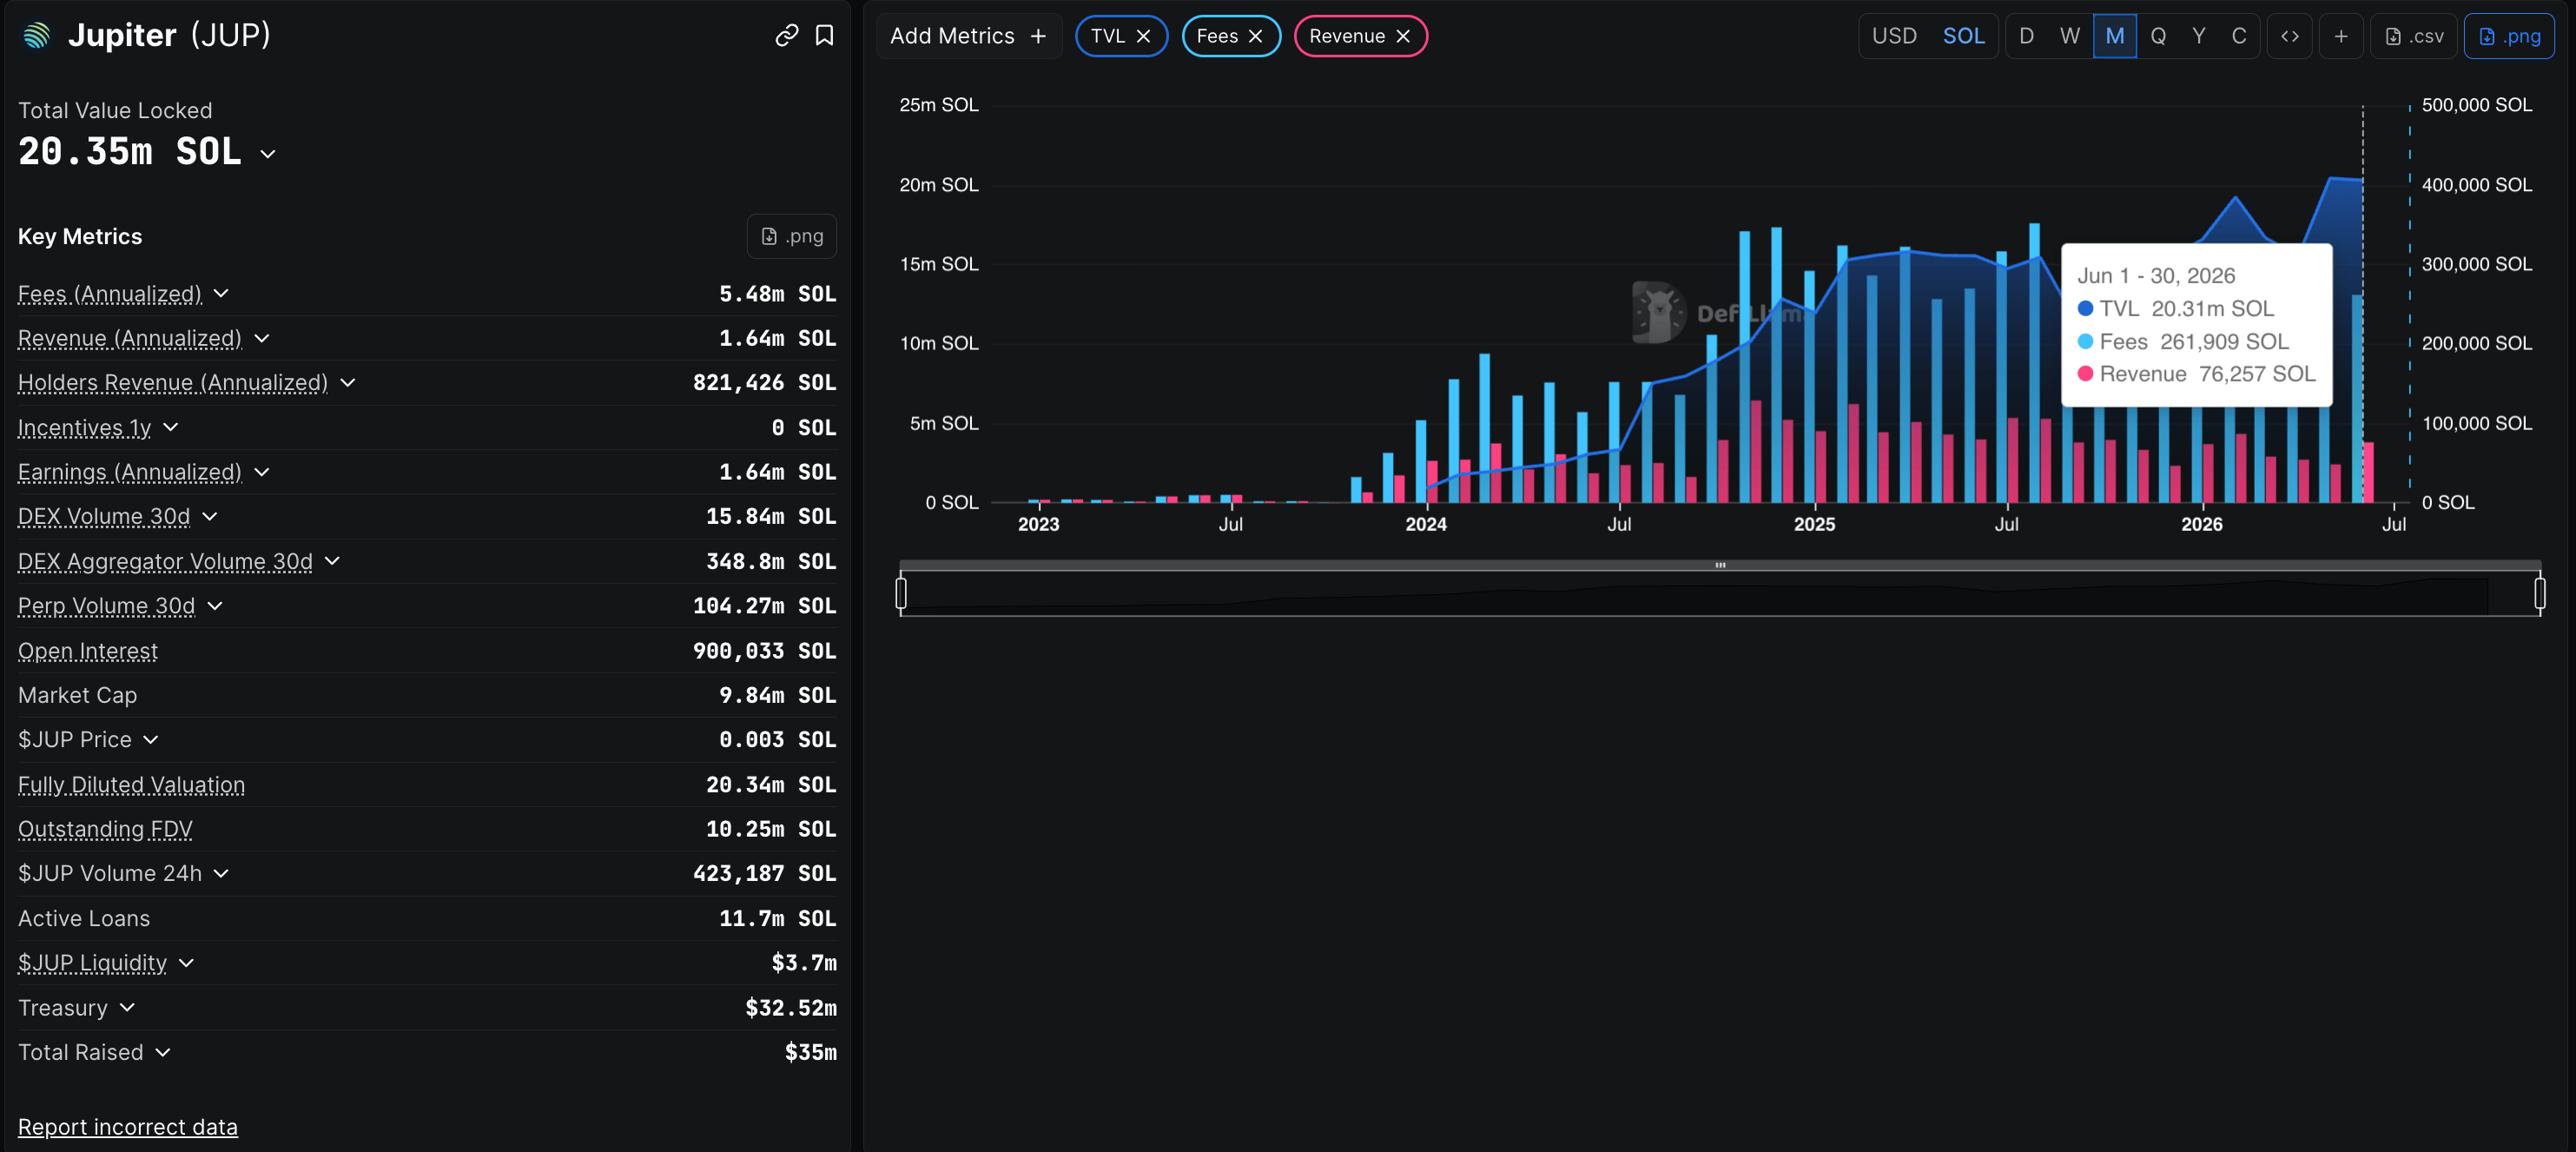
- Network data shows a spike in monthly revenue and fees in June to a three-month high.
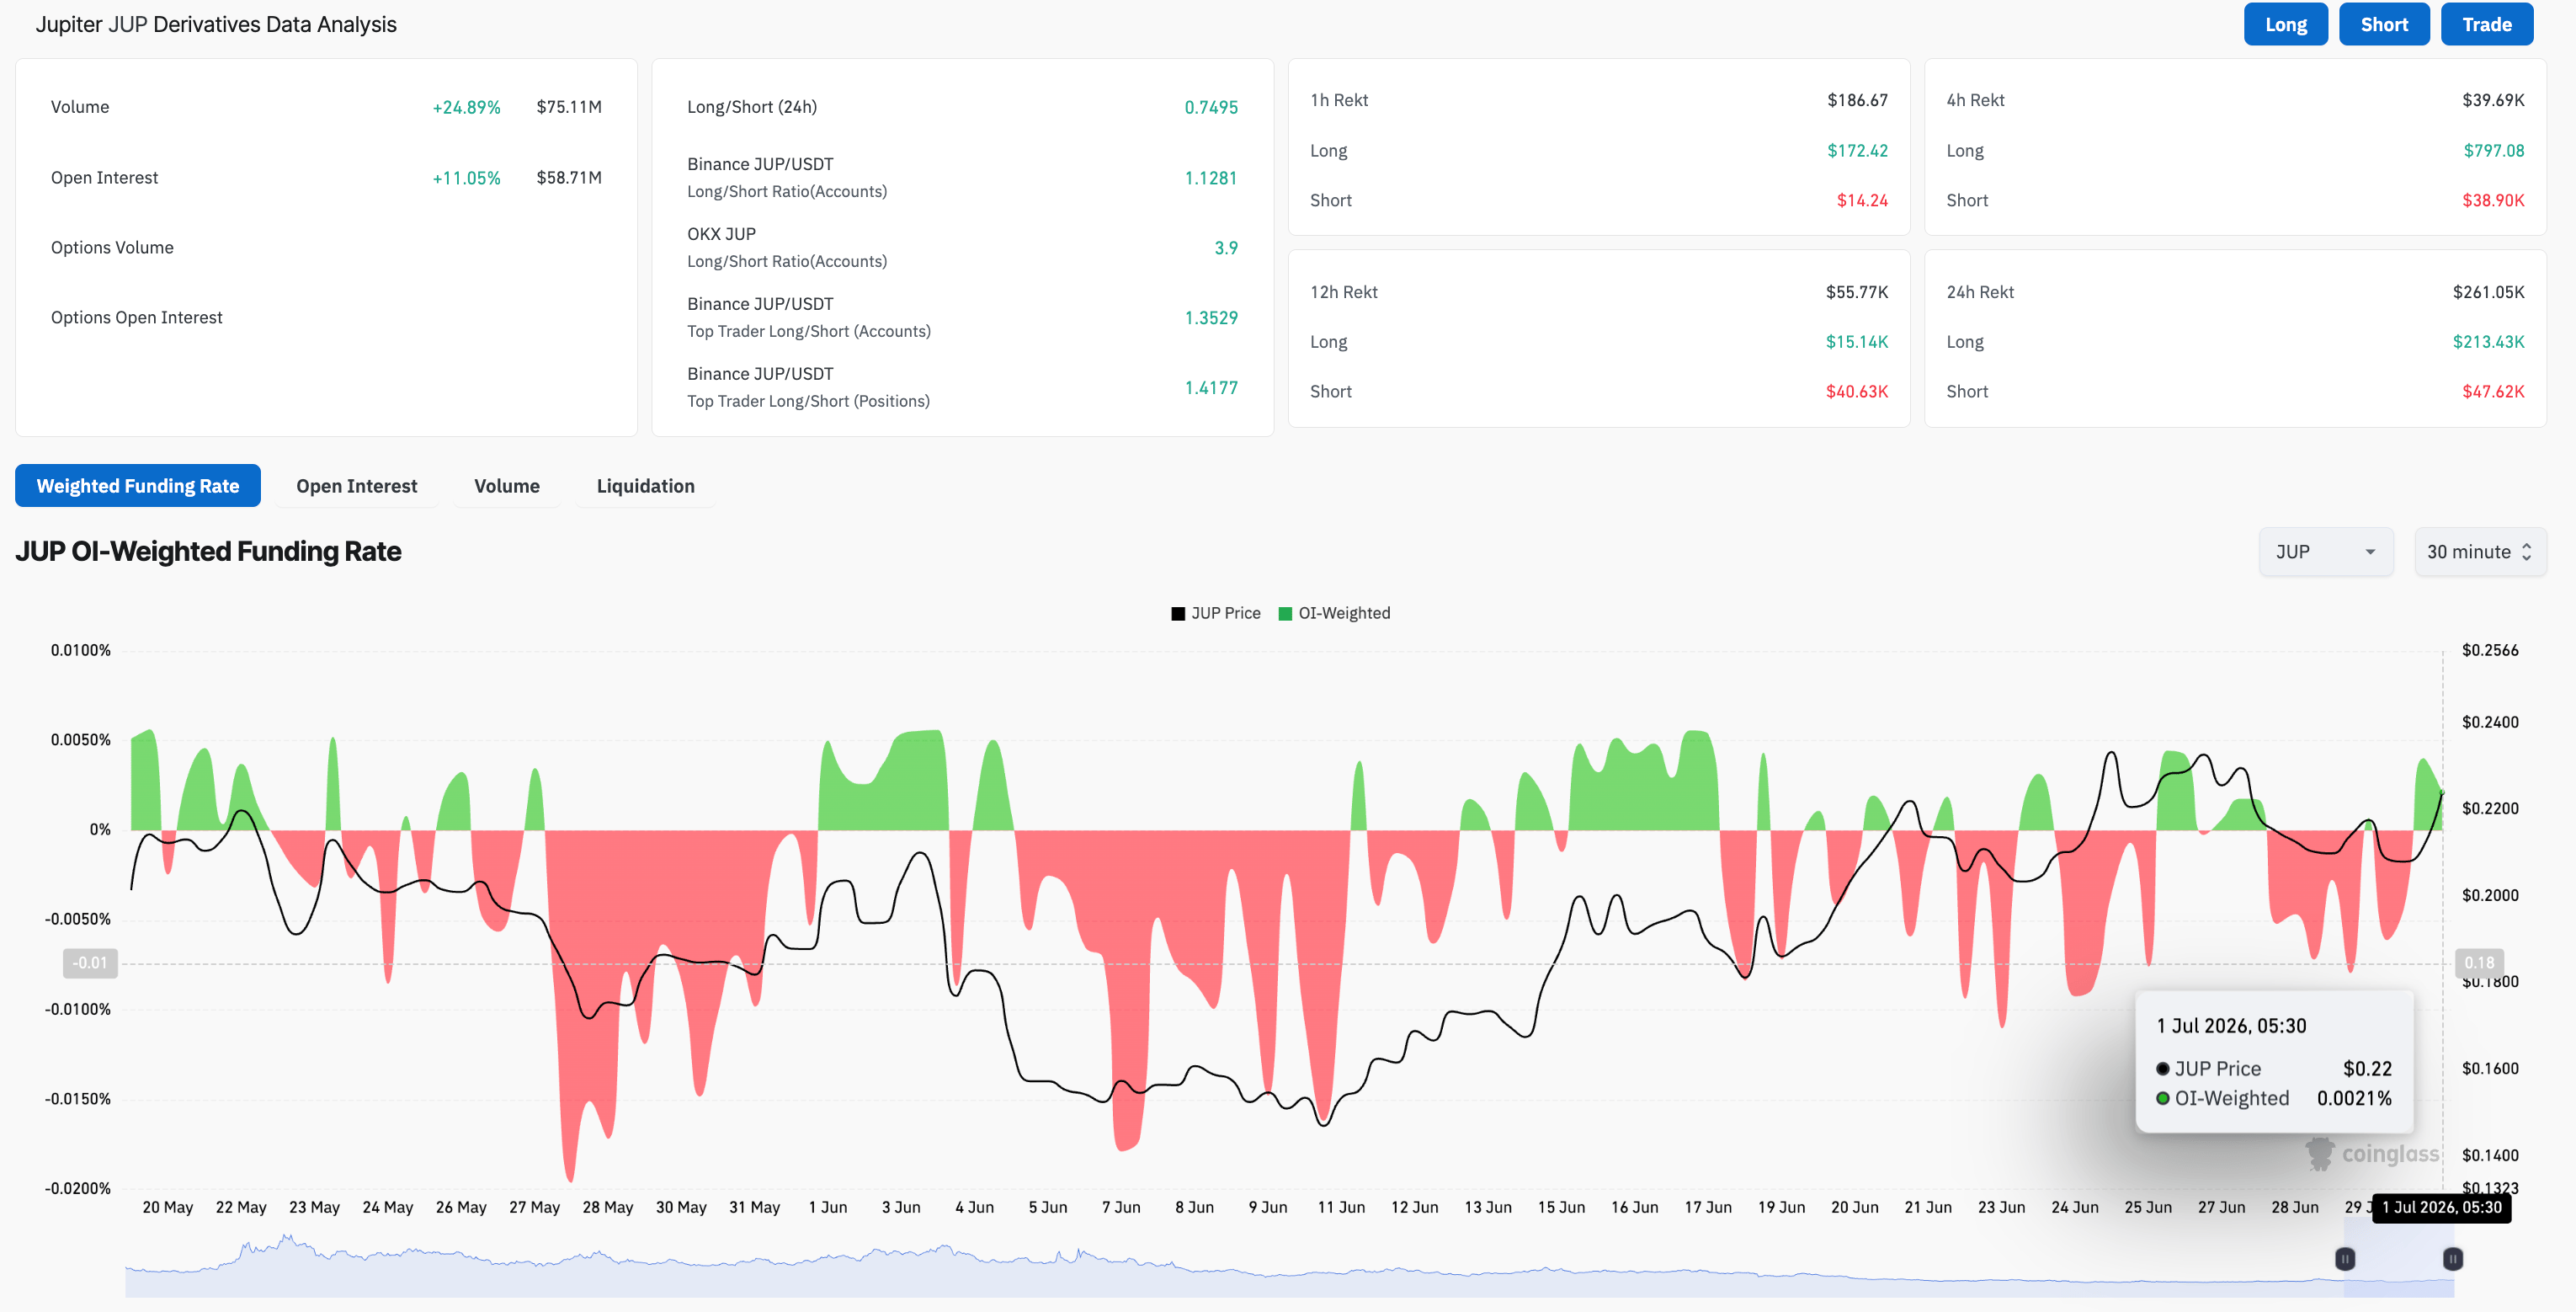
- Retail demand supports the recovery in JUP, with Open Interest up 11% over the last 24 hours, reflecting a positional buildup.

Jupiter (JUP) edges higher by 6% at press time on Wednesday, testing the 200-day Exponential Moving Average (EMA) breakout at $0.2192. A fresh spark in monthly revenue and fees, reaching a three-month high, reflects renewed user demand on the network, backed by a near-term rise in retail confidence as Open Interest jumps 11% in 24 hours.
The technical outlook for Jupiter is mixed, with a short-term recovery poised to test the breakout of the overhead resistance zone near $0.2400.
Jupiter’s network activity and retail support pick up
Jupiter, a Solana-based Decentralized Exchange (DEX), regains network demand after three months of steady decline. DeFiLlama data show that user fees and revenue have surged to 261,909 SOL and 76,257 SOL, respectively, despite broader market risk-off sentiment. The fresh surge reaffirms Jupiter’s dominance in the DeFi industry, which could boost demand for its JUP token.
On the derivatives front, CoinGlass data show JUP Open Interest (OI) rising 11% over 24 hours to $58.71 million, suggesting a surge in leverage-driven positional setups. In addition, the funding rates of 0.0021% reflect near-term bullish sentiment among traders, who are willing to take long positions at a premium.
Technical outlook: Will JUP price break above its prevailing downtrend trendline?
Jupiter shows a bullish recovery attempt, heading to challenge a declining resistance trendline near $0.2325. At the time of writing, JUP is roughly 6% on Wednesday, with intraday gains crossing above the 200-day EMA at $0.2192.
From a technical perspective, the DeFi token is heading toward a confluence of resistance at the declining trendline and the 78.6% Fibonacci retracement level at $0.2372, measured from the upswing from $0.1350 to $0.2766. A decisive close above this zone could confirm a more decisive bullish extension, targeting the previous swing high near $0.2766, followed by the 127.2% Fibonacci extension level at $0.3361.
The Relative Strength Index (RSI) at around 59 on the daily chart remains above the midline, as buyers retain control. At the same time, the Moving Average Convergence Divergence (MACD) is close to its signal line, while the histograms contract, suggesting easing upside momentum.
On the downside, initial support aligns with the 50-day EMA at $0.1971, near the 50% retracement at $0.1932, followed by the 23.6% retracement at $0.1599.
(The technical analysis of this story was written with the help of an AI tool.)
Author

Vishal Dixit
FXStreet
Vishal Dixit holds a B.Sc. in Chemistry from Wilson College but found his true calling in the world of crypto.