Weaponizing the Dollar; Gold Mining Stocks Chart Path to Breakout

Federal Reserve Chairman Jerome Powell’s comments on inflation last Wednesday added fuel to the contra-dollar trade.
During a press conference following the Fed’s decision to leave interest rates unchanged, Powell said, “In order to move rates up, I would want to see inflation that's persistent and that's significant. A significant move up in inflation that's also persistent...
"To move inflation expectations up from where they are, which appears to be a bit below 2%, will not happen overnight."
In other words, the Fed won’t be satisfied until consumer prices rise much higher over time.
This “weak dollar” policy may come back to bite, though, as the Federal Reserve Note steadily loses credibility as world reserve currency.
Over the weekend, Treasury Secretary admitted as much.
“People don’t have to use the dollar, we have the right to put restrictions on people using the dollar. And over a long period of time, if we’re not careful, people will look at using other currencies,” Mnuchin said Saturday in a CNBC interview.
Despite insisting that “we are not weaponizing the U.S. dollar," Mnuchin’s Treasury Department is leveraging the dollar’s privileged status in international trade to impose and enforce economic sanctions against U.S. adversaries. They include North Korea, Venezuela, Iran, and Russia.
But as CNBC noted, “Officials in China and Europe have been actively promoting their currencies as substitutes for the dollar when it comes to both reserves and transactions, particularly in the face of expanding U.S. sanctions and protectionist trade policies like tariffs.”
The central banks of China and Russia are also steadily replacing their sizable Federal Reserve Note reserves with gold.
Gold Mining Stocks Chart Pathway for Gold Breakout
Gold and silver prices remain mired in weeks-long trading ranges. They are essentially moving sideways – for now.
Precious metals mining stocks, however, are moving up. The chart of the HUI gold miners index shows an uptrend in place since mid-October.
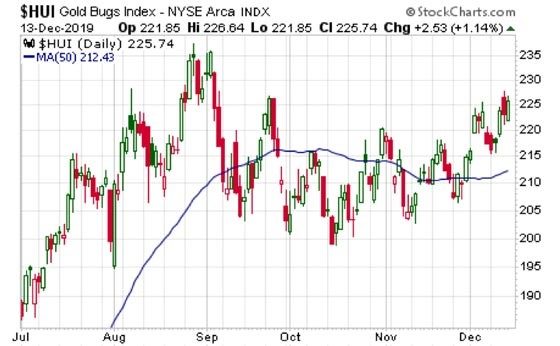
The HUI has traded above its 50-day moving average for several days in a row. The 50-day line itself is now also curling up, confirming underlying technical strength.
If the HUI is a leading indicator for spot gold (and it often is), then gold prices may be on the verge of also breaking out. Gold closed last Friday right at 50-day moving average resistance.
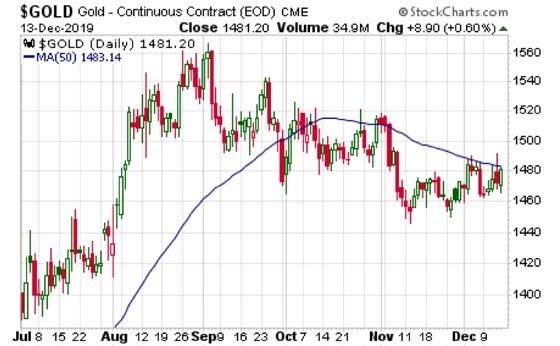
A couple strong closes above the 50-day line should put gold on a pathway to an extended rally.
Silver, meanwhile, has been trading around the $17.00/oz level for the past five weeks and needs to break above $17.30, then $17.50, to get something going on the upside.
Bulls can take encouragement in the impressive outperformance of the Silver Miners ETF (NYSE:SIL). It gained 4.5% last week to reach a three-month high. Another move of that magnitude this week would put SIL at a new high for the year – and give silver itself some catching up to do!
To receive free commentary and analysis on the gold and silver markets, click here to be added to the Money Metals news service.
Author

Stefan Gleason
Money Metals Exchange
Stefan Gleason is President of Money Metals Exchange, the national precious metals company named 2015 “Dealer of the Year” in the United States by an independent global ratings group.
















