|

Oil ($CL_F) impulsive Wave structure suggests further losses

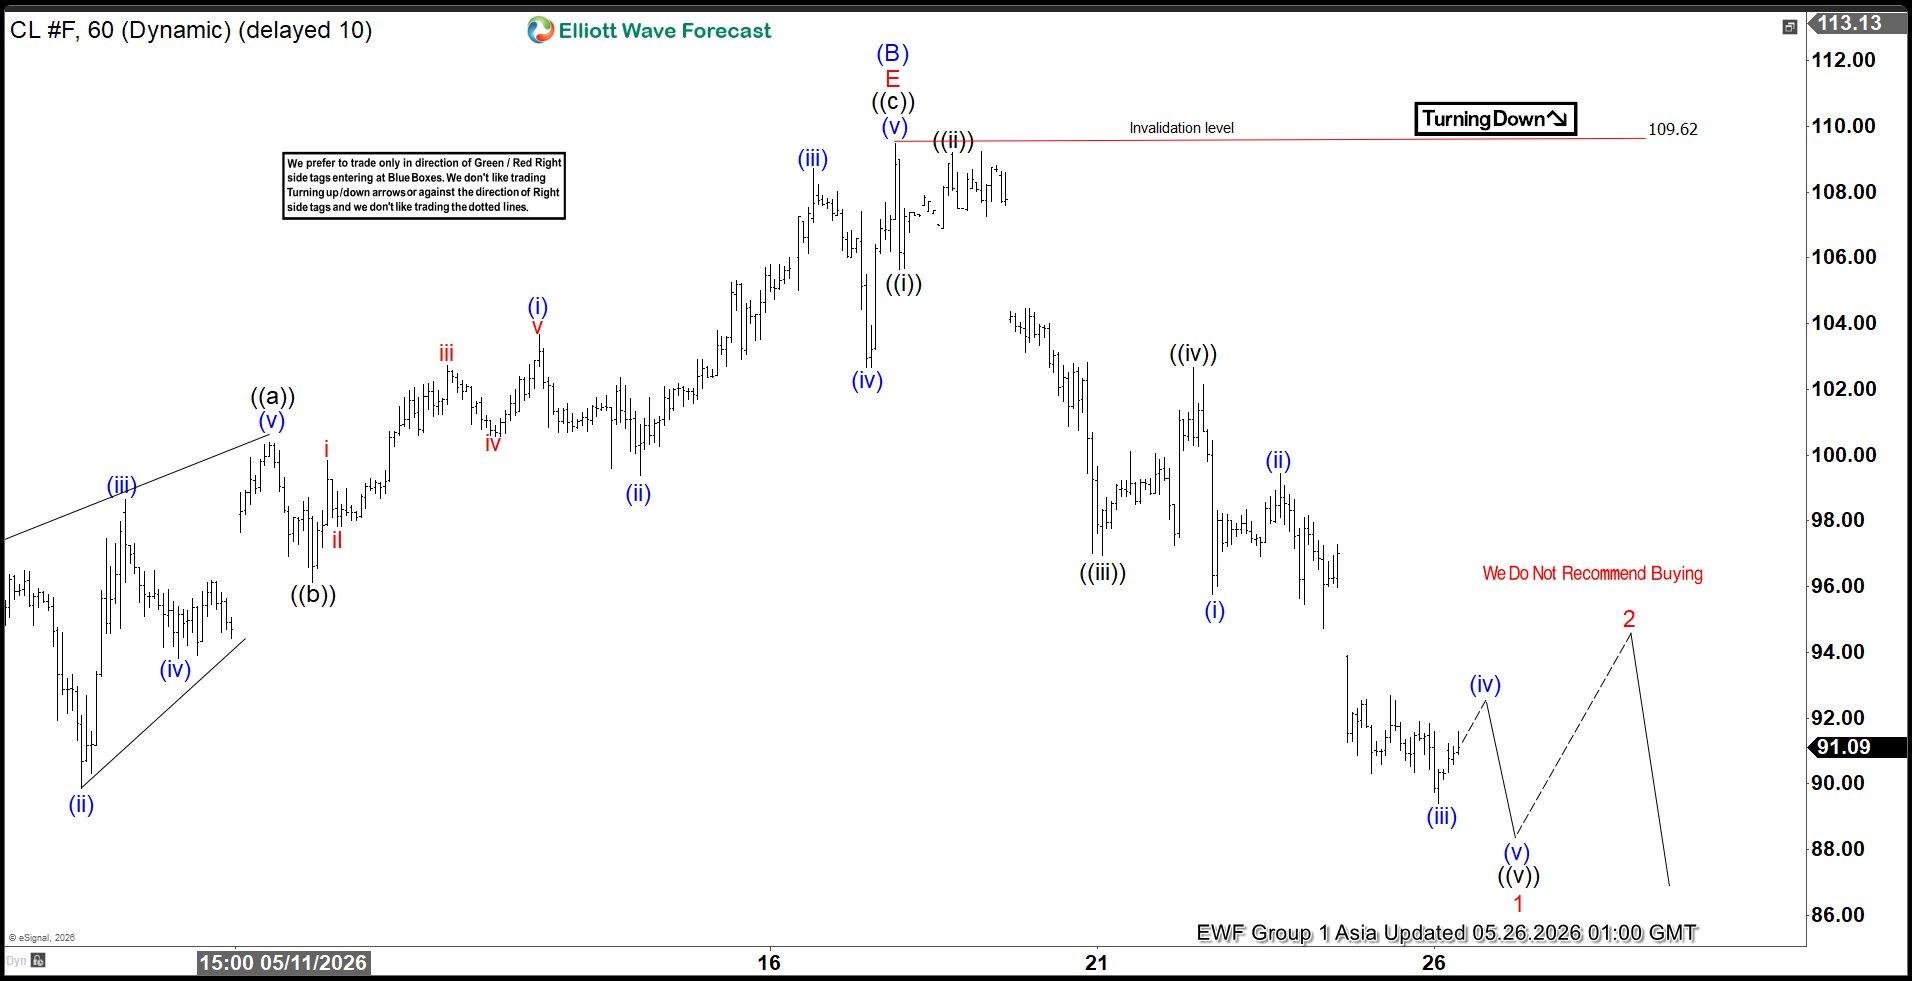
The short‑term Elliott Wave view on Oil indicates that after spiking to $119.48 in response to the war with Iran, prices have moved sideways for several months. The initial decline from that peak to $76.73 on March 11, 2026 appeared impulsive and likely completed wave (A). Following that move, Oil consolidated in a triangle‑like structure until recently. Within this formation, wave (B) was identified at $109.62, as illustrated in the one‑hour chart.

From that level, Oil resumed lower in wave (C). However, a decisive break below the $76.73 low of wave (A) remains necessary to confirm this bearish view. Down from $109.62, wave ((i)) ended at $105.65, while the corrective rally in wave ((ii)) concluded at $109.2. Oil then extended lower in wave ((iii)) towards $96.94, followed by a bounce in wave ((iv)) that ended at $102.66. The market is now expected to push to a few more lows to complete wave ((v)), thereby finishing wave 1 of a higher degree.

Once wave 1 concludes, Oil should rally in wave 2 to correct the cycle from the May 19, 2026 high. This correction is anticipated to unfold in 3 or 7 swings before the broader downtrend resumes. As long as the pivot at $109.62 remains intact, rallies are expected to fail in 3, 7, or 11 swings, favoring further downside. The structure highlights a mature bearish cycle, with near‑term risks skewed toward continuation of weakness rather than sustained recovery.

Light Crude Oil (CL_F) 60-Minute Elliott Wave Chart

CL_F Elliott Wave video:

Youtube preview

Author

Elliott Wave Forecast Team

Elliott Wave Forecast Team

ElliottWave-Forecast.com

More from Elliott Wave Forecast Team
Share:

Editor's Picks

AUD/USD eyes 0.7150 barrier nine-day EMA

AUD/USD inches higher after registering modest losses in the previous day, trading around 0.7130 during the Asian hours. The technical analysis of the daily chart indicates that the pair is moving sideways within the rectangle pattern, suggesting a consolidation as neither the bulls nor the bears have enough momentum to take control of the market.

USD/JPY trades below 160.00 intervention threshold; bullish bias intact

The USD/JPY pair attracts some sellers during the Asian session amid fears that authorities will step in again to prop up the Japanese Yen. Furthermore, the Israel-Lebanon truce prompts some profit-taking around the US Dollar and exerts downward pressure on the currency pair.

Gold meets contention near $4,420…for now

Gold extends its recovery past the $4,500 mark per troy ounce on Thursday. The yellow metal’s advance comes amid the resurgence of some selling interest around the, improving risk sentiment, and declining US Treasury yields across the curve.

Bitcoin’s massive storm is back: Why the sell-off is far from over

Bitcoin price action over the last few weeks has felt less like a normal, healthy correction and more like a slow grinding crash that continues to wreak havoc on holdings and trading accounts. And everything suggests that the dramatic crash isn’t over.

Nonfarm payrolls: Testing the limits of Fed policy patience

The upcoming nonfarm payrolls report for May will provide the final update on the US labor market before Kevin Warsh attends his first policy meeting as the new Fed Chair later this month.

Recession on paper: What really moves the Canadian Loonie now?

Statistics Canada handed the headline writers a gift and the analysts a headache. Real GDP shrank 0.1% on an annualized basis in the first quarter, and with the fourth quarter of 2025 revised down to a 1.0% contraction, that is two negative quarters in a row, the textbook definition of a technical recession and Canada's first since the pandemic.