Navigating EUR/USD, USD/JPY, Gold, and Bitcoin in volatile markets

To help retail clients make informed decisions, we at Elev8 broker have prepared this general outlook on EURUSD, USDJPY, gold, and Bitcoin. Understanding broad trends helps traders plan their strategies more effectively, particularly during today's market turbulence. However, these periods also bring new opportunities, and retail investors often opt for Contracts for Difference (CFDs) to use leverage and maximise potential gains. But amid heightened volatility, CFDs bring additional risks, so implementing a strict risk management strategy with clear stop-loss and take-profit orders becomes an absolute necessity. The aim of this mid-term outlook is to support trading strategies in the current uncertain financial market environment.
Macro environment
We are living in an era of heightened uncertainty and unpredictable volatility across the financial market. Excessive money printing by central banks, combined with ongoing geopolitical chaos, has created a new reality, leaving many traders and investors with the sense that a broader crisis could erupt at any moment. The Iran conflict continues to weigh heavily on sentiment across all asset classes. Recent U.S. strikes on Iran have dented optimism for a swift resolution of the conflict and delayed the reopening of the Strait of Hormuz, which is so crucial for global oil supply. Although charts indicate that some commotion has been subsiding, with S&P 500 trading near all-time highs and Brent crude trading near one-month lows, the oil price remains approximately 25% above pre-war levels, keeping energy-driven pressures alive.
Fundamentally, every active trader and investor is most concerned about the return of inflation and its potential impact on the U.S. and global monetary policy. According to the latest interest rate swaps market data, investors are now pricing in absolutely no change in the Federal Reserve (Fed) benchmark rate until October 2026, followed by a gradual increase thereafter. In fact, expectations for meaningful rate cuts have vanished across virtually every major central bank.
This macro backdrop influences every asset class, from currencies to commodities and crypto, urging retail traders to remain vigilant.
Gold (XAU/USD)
Gold recently fell to a two-month low as war-driven inflation fears fueled renewed bets on interest-rate hikes. Indeed, bullion has remained under constant pressure ever since the U.S.-Israeli conflict with Iran began. The effective closure of the Strait of Hormuz triggered a surge in crude oil prices, intensifying inflation concerns and boosting expectations for higher interest rates. Although gold traditionally serves as an inflation hedge and safe-haven commodity, it struggles in high-rate environments because it is a non-yielding asset. The market now sees energy-driven inflation prompting the Fed to hike its benchmark overnight interest rate by 25 basis points (bps) by the end of this year. Meanwhile, Minneapolis Fed President Neel Kashkari recently emphasised that the central bank must focus on containing inflationary risks that appear to be building. However, it is 'far too soon' to predict any policy shift.
Kar Yong Ang, a financial market expert at Elev8 broker, noted the following regarding the situation: 'The traditional relationship between geopolitical risk and gold is being tested by aggressive central bank positioning, meaning traders must look past safe-haven headlines and focus on real interest rates'.
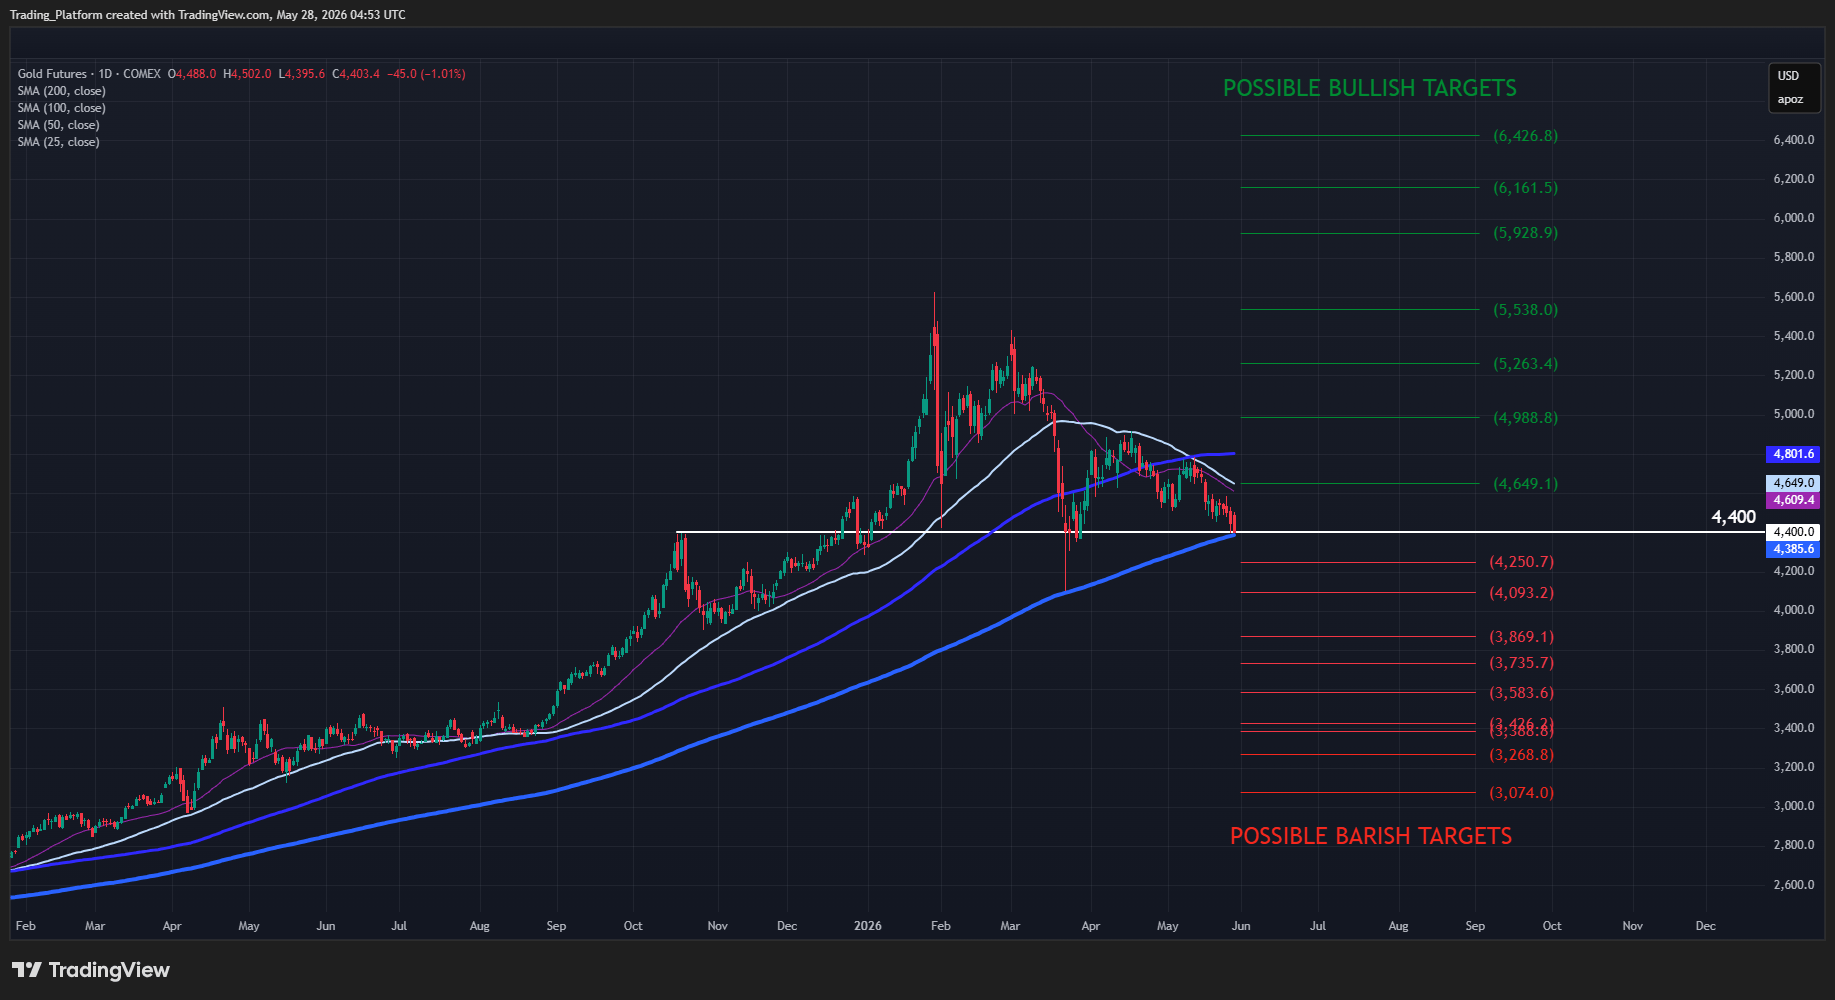
Technically, the long-term trend for XAUUSD remains bullish. At the same time, the metal is now approaching critical support near the 200-day moving average, which coincides with structural support around the 4,400 level. A decisive break below this level could damage bullish sentiment and encourage bears to target the 4,000 level. The baseline scenario, however, favours a rebound from current levels, with the nearest upside target near 4,666.
Spot Gold daily chart (COMEX)
Euro (EUR/USD)
The most prevalent issue affecting the common currency remains the Persian Gulf conflict. While no definitive diplomatic agreement has been reached yet, other markets, including United States Treasury yields and major equity indices, are trading with optimism that a peace deal is close. Consequently, the EURUSD continues to find decent support. However, this stability may be misleading, as growing market complacency suggests investors may be pricing in an overly optimistic outcome too soon.
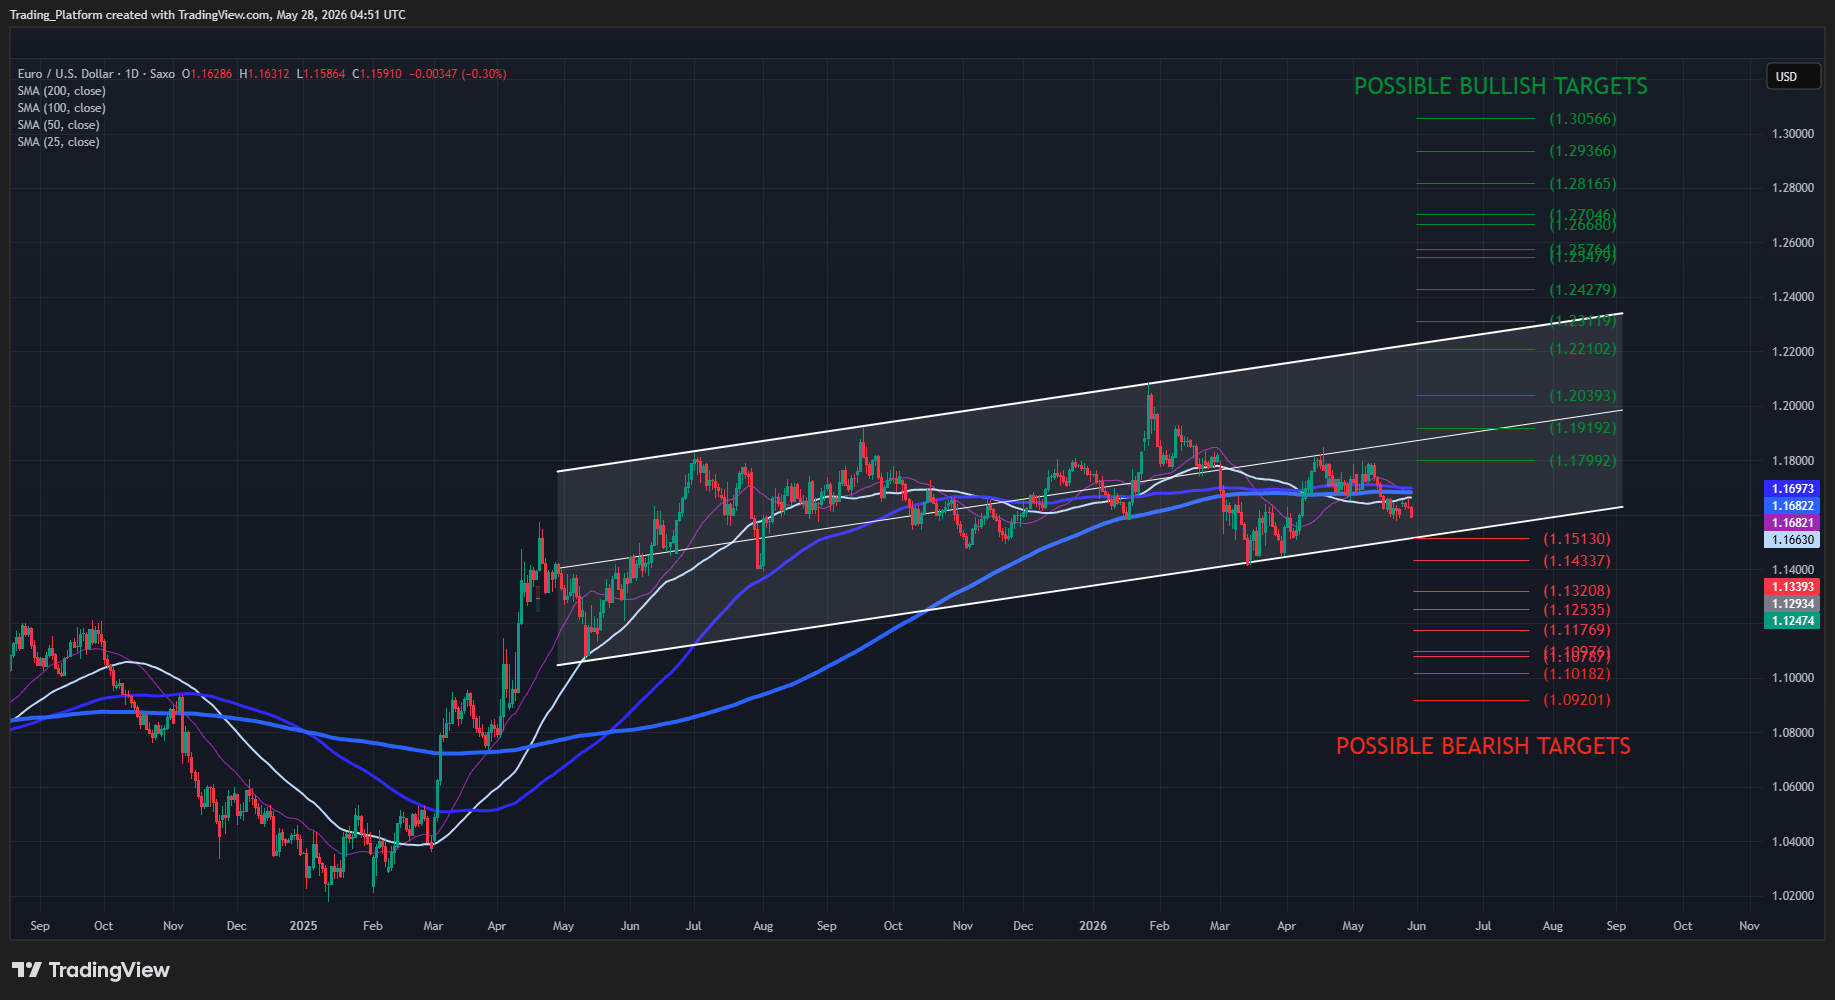
From a technical perspective, the EURUSD currency pair has been trading within a bullish parallel channel for more than a year now. However, the slope of this channel is very gentle and shallow. Because of this weak slope, the euro is essentially trading sideways within a broad range between 1.14000 and 1.18000. On one hand, this price action creates both clear selling and buying opportunities at the boundaries. On the other hand, this range-bound movement indicates deep indecisiveness and structural uncertainty within the marketplace.
The euro is likely to remain highly sensitive to geopolitical headlines and incoming U.S. inflation data in the near term, keeping traders cautious about committing to major directional biases. An escape from the established range will suggest the direction of the trend. 1.14300 is a major support, while 1.18000 is a major resistance.
EUR/USD daily chart
Japanese Yen (USD/JPY)
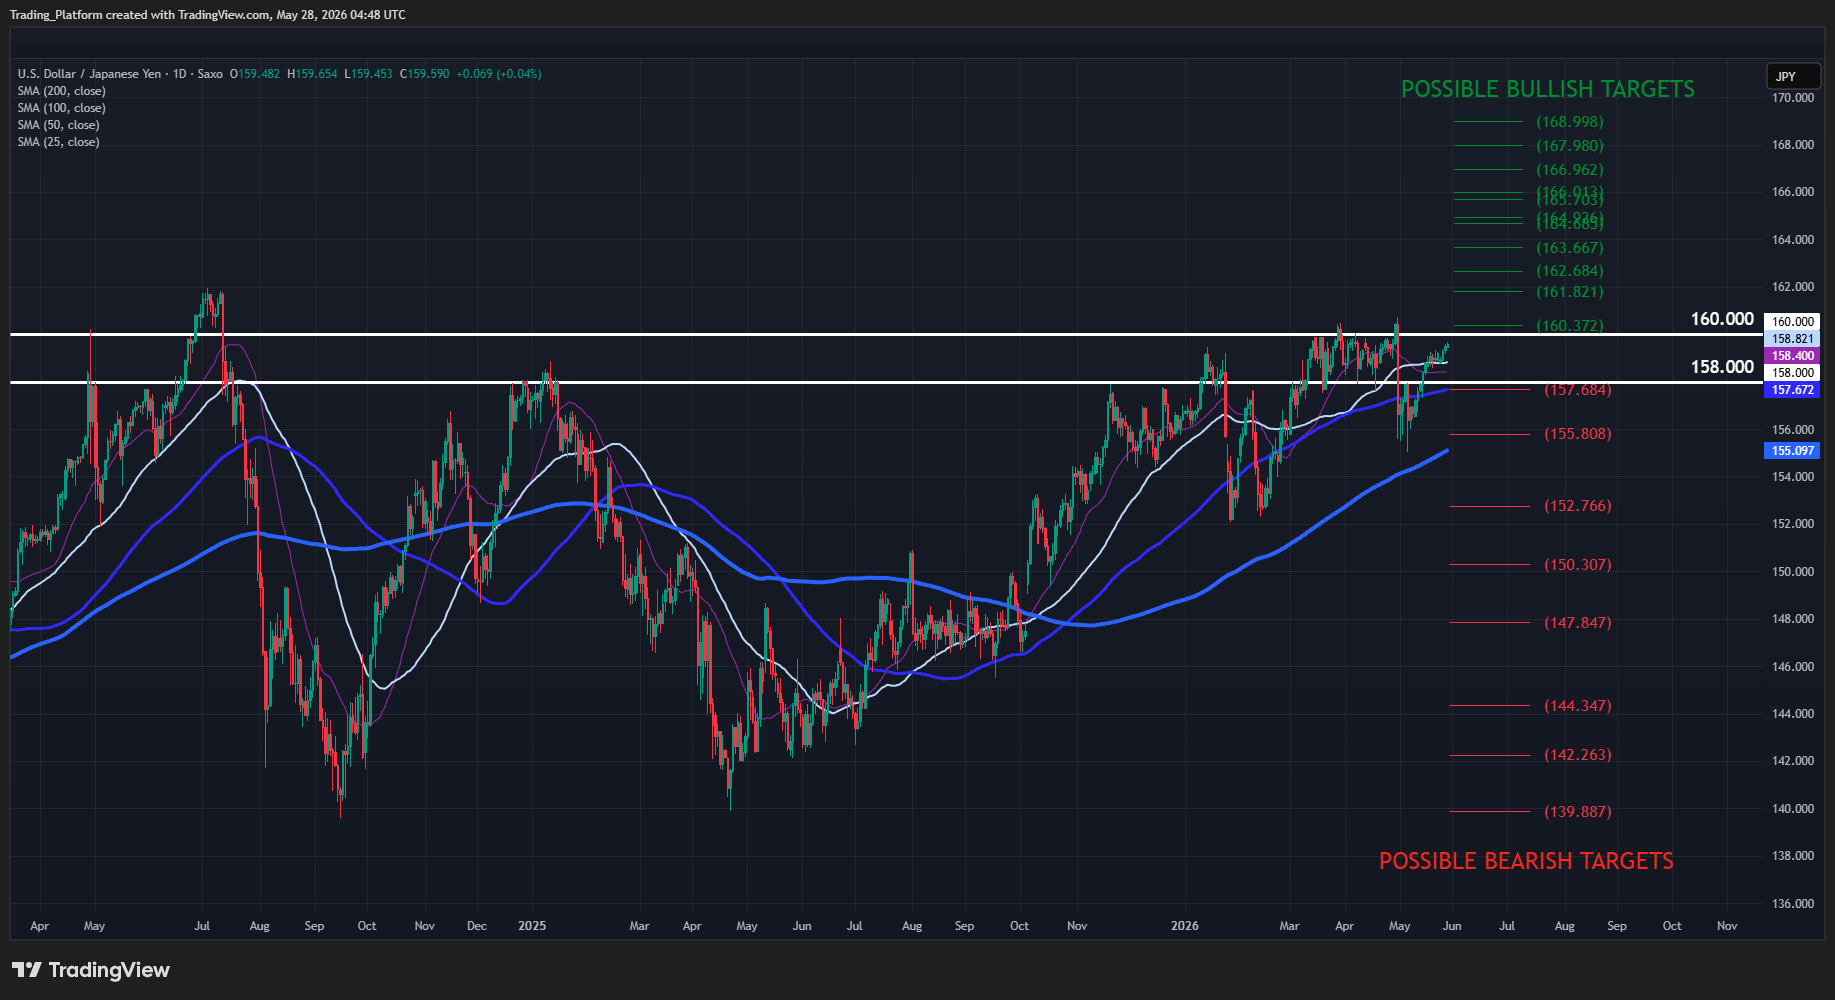
Because the war tensions in the Persian Gulf lifted the U.S. dollar, the Japanese yen continued to slide. In fact, USDJPY is now approaching the 160.00 level, a four-week low. This comes despite markets pricing in roughly a 70% chance of a quarter-point interest rate hike at the Bank of Japan's (BOJ) June 15–16 policy meeting.
Technically, the 160.00 level is vital from both a technical and fundamental standpoint, as it marks the threshold where the Japanese authorities are widely expected to step in and halt further yen devaluation. While the underlying technical trend in USDJPY is clearly bullish, betting on an immediate breakout carries significant risk, as price action suggests it is entering a classic exhaustion phase. A practical approach for retail traders is to maintain a buy-on-dips bias, provided that the price successfully defends the key psychological level at 158.00. The primary upside targets for this forecast sit at 160.40 and 161.80. Alternatively, a rejection of 160.00 level or a clean break below key structural support at 158.00 would trigger a fresh wave of selling, exposing downside targets at 155.80 and 152.80.
USD/JPY daily chart
Bitcoin (BTC/USD)
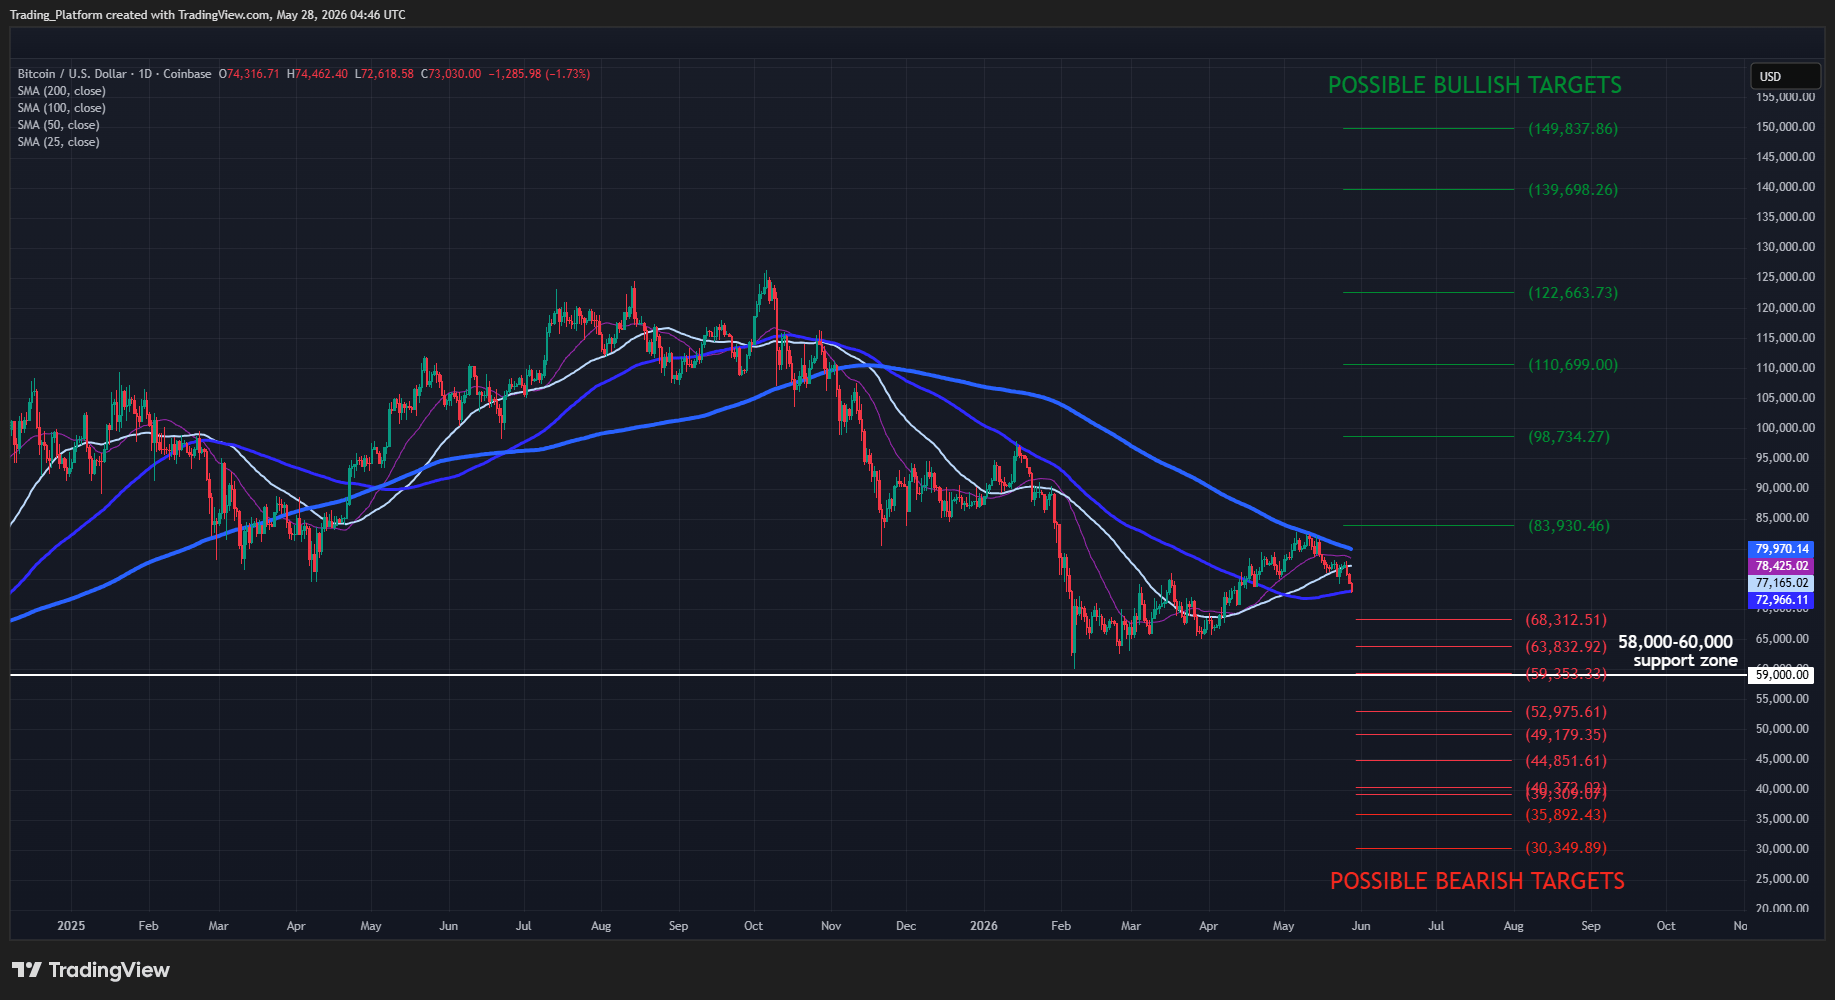
The crypto market is also experiencing pressure due to geopolitical tensions. Specifically, Bitcoin (BTCUSD) faces the risk of further downside movement, but the reason is not only the escalating situation in Iran. Kar Yong Ang, a financial market expert at Elev8 broker, notes that 'digital assets are behaving less like independent assets now and more like risky tech stocks during this crisis. If the conflict worsens, Bitcoin could drop further toward the 65,000 support zone'.
This selling pressure is exacerbated by the fact that Bitcoin spot trading volumes have fallen to 10-month lows, indicating insufficient buying conviction to sustain any meaningful recovery. Meanwhile, higher funding rates in derivatives markets have surged, suggesting leveraged long positions could face rapid liquidations if prices turn lower. Bitcoin ETF flows have also recorded seven consecutive days of outflows, reinforcing the prevailing bearish tone.
While a rebound from current levels remains possible depending on near-term supply and demand dynamics, the failed attempt to break above 80,000 level suggests that bulls are not yet in control. In this environment, retail traders should approach bitcoin CFD positions with caution, applying conservative leverage, strict stop loss levels below 75,000, and realistic take-profit targets on any relief rallies. The mid-term forecast remains one of elevated caution, with further downside pressure likely unless macro conditions improve significantly.
BTC/USD daily chart
Author
Kar Yong Ang
Elev8
Over 10 years of experience in financial analysis and trading. Initially started as a trader and transitioned to analytical roles, specializing in technical analysis and market trend forecasting.


