Natural Gas: Where are the bulls?

Yesterday, bears pushed the price to the lowest level since Sep. 2020! What’s next?
Analyzing the bear's grip
This week’s price action showed once again the weakness of the buyers, which resulted in an important technical event. Could this have been predicted? Yes! I invite you to read today's article, in which you will find out what technical factors influenced the recent drop in natural gas. Have a nice read.
Let’s start today’s analysis with quotes from the last commentary on natural gas published a week ago:
(…) the current situation of the bulls doesn’t look encouraging – especially when we factor in yesterday’s volume, which increased once again, confirming the bears’ involvement in the decline.
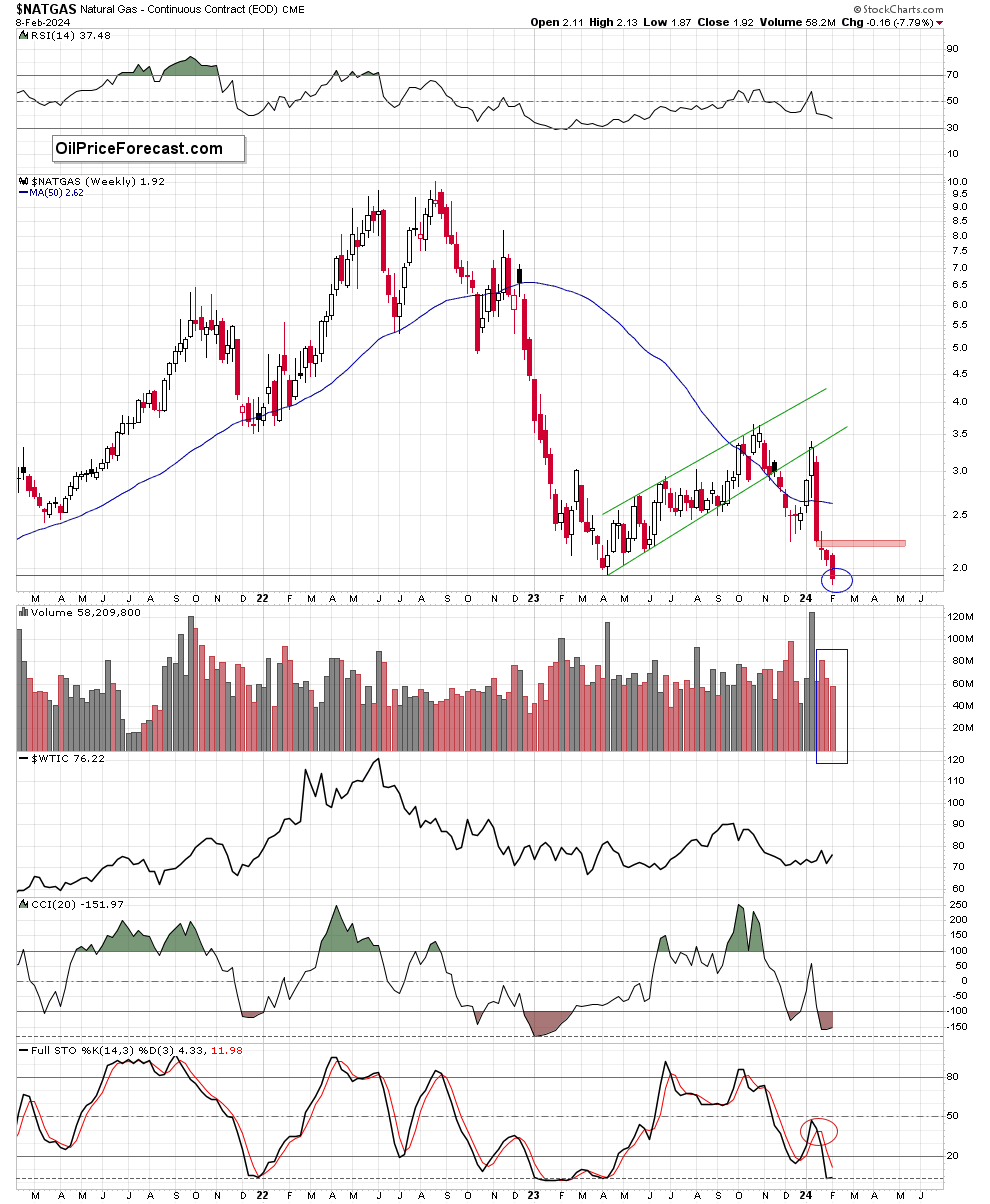
Additionally, when we take a look at the weekly chart below, we see that the Stochastic Oscillator generated a sell signal, giving the sellers even one more reason to act.
So, what can we expect in the coming days?
If the sellers manage to close the day under the lower border of the orange consolidation (marked on the daily chart), we could see a decline even to around 1,928, where the size of the downward move would correspond to the height of the formation.
(…) And what else could happen if the bulls failed once again and allowed the bears to move below (…)?
The answer to this question can be found in the monthly chart below.
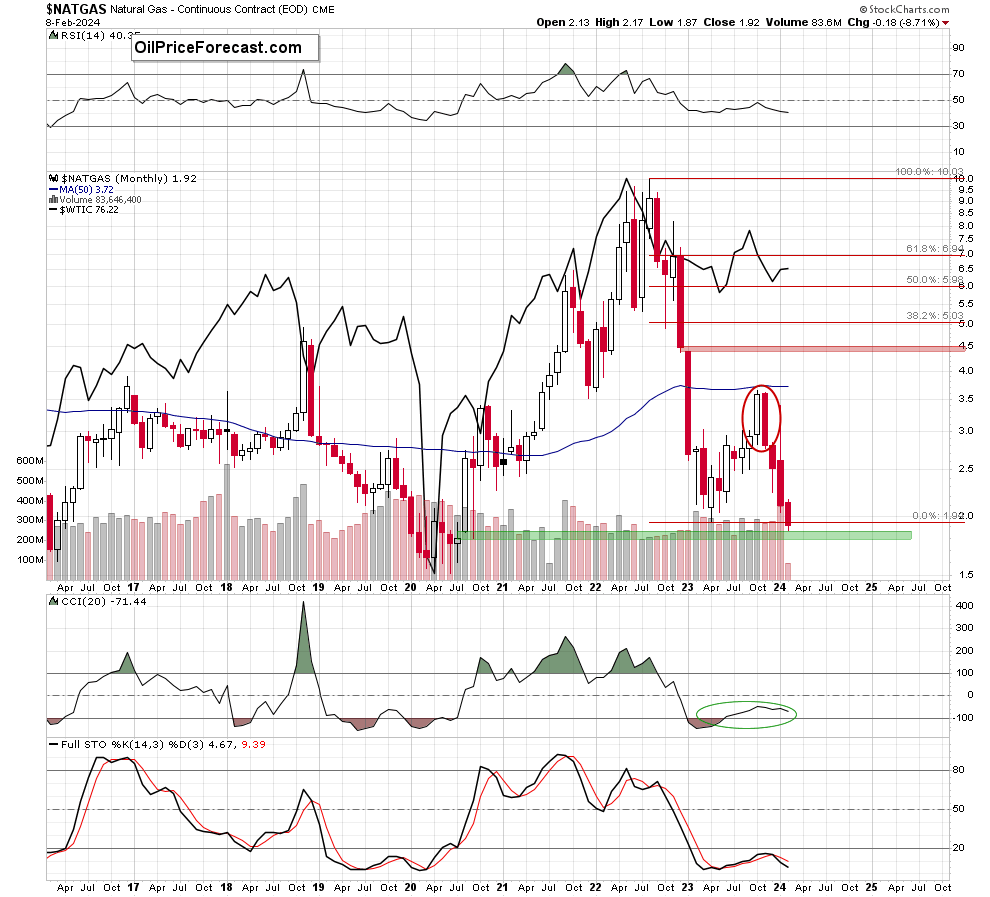
(…) if the bulls fail and are unable to defend their last ally, the road to not only mentioned 1,928, but also to the green supportive gap (1.80-1.86) could be open.
From today’s point of view, we see that the situation developed in accordance with the quoted pro-declining scenario, and the bears reached the target mentioned in the last article during yesterday's session.
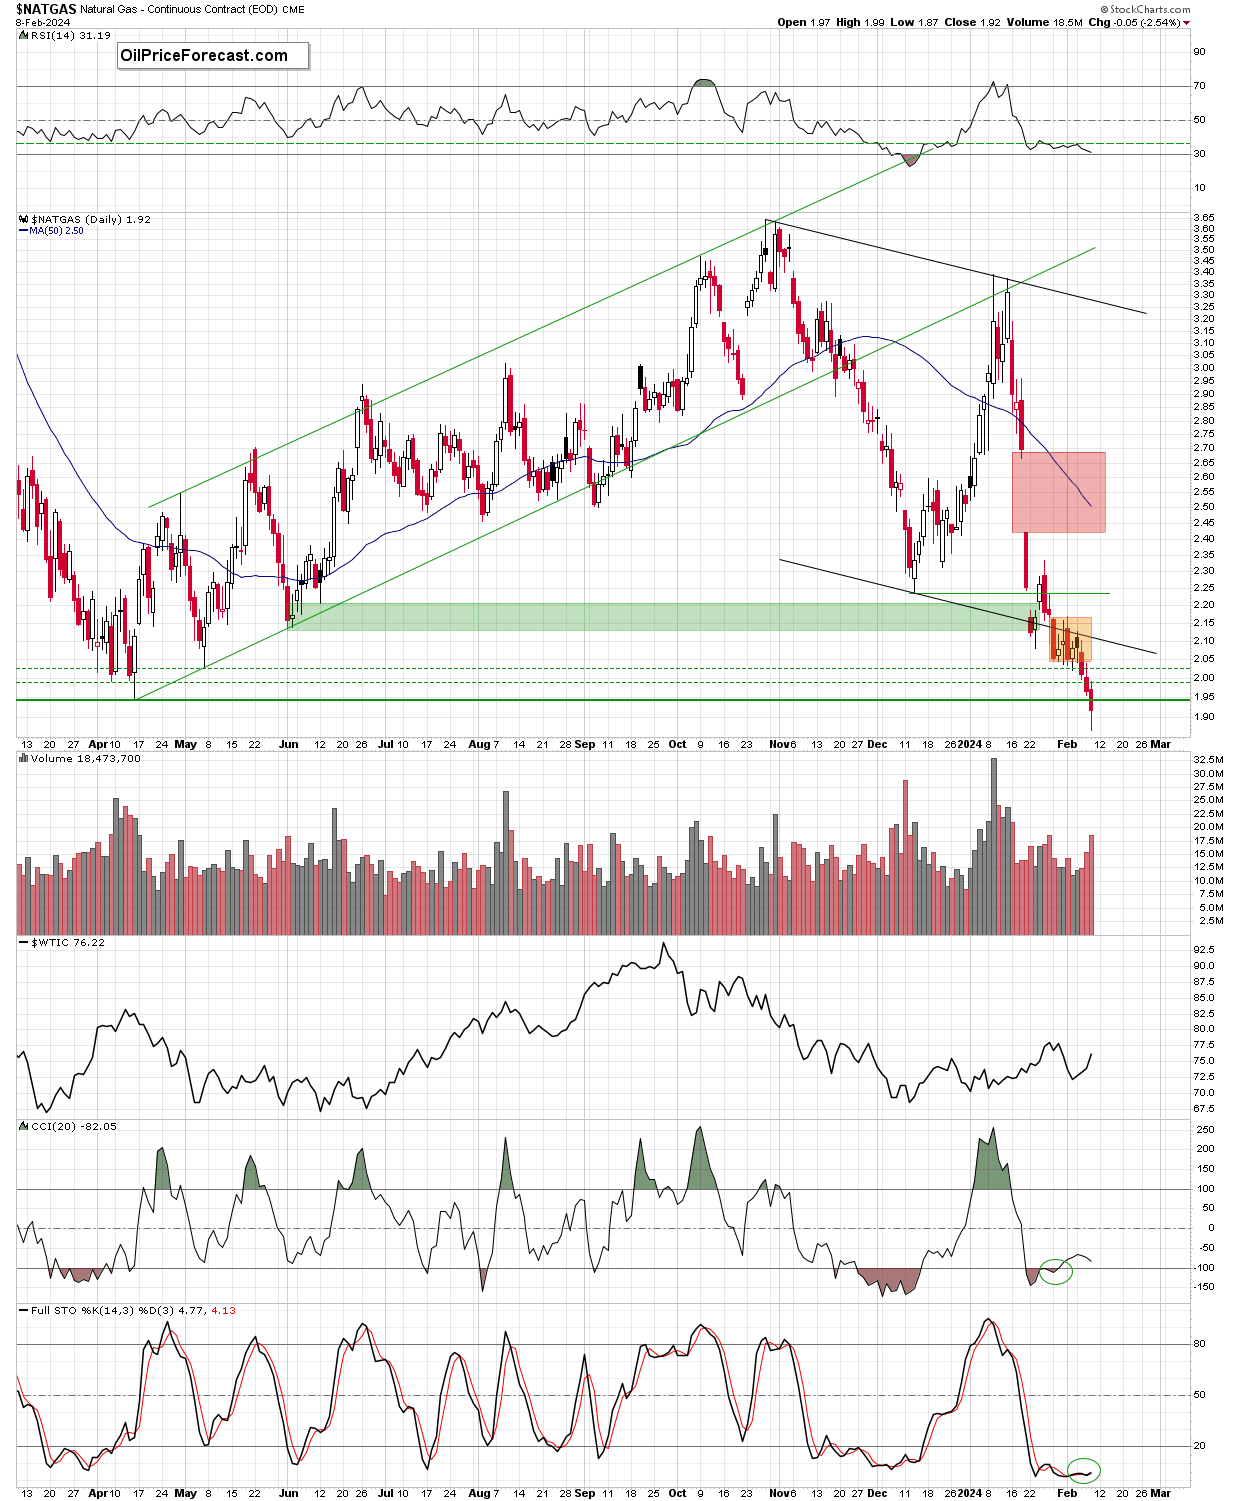
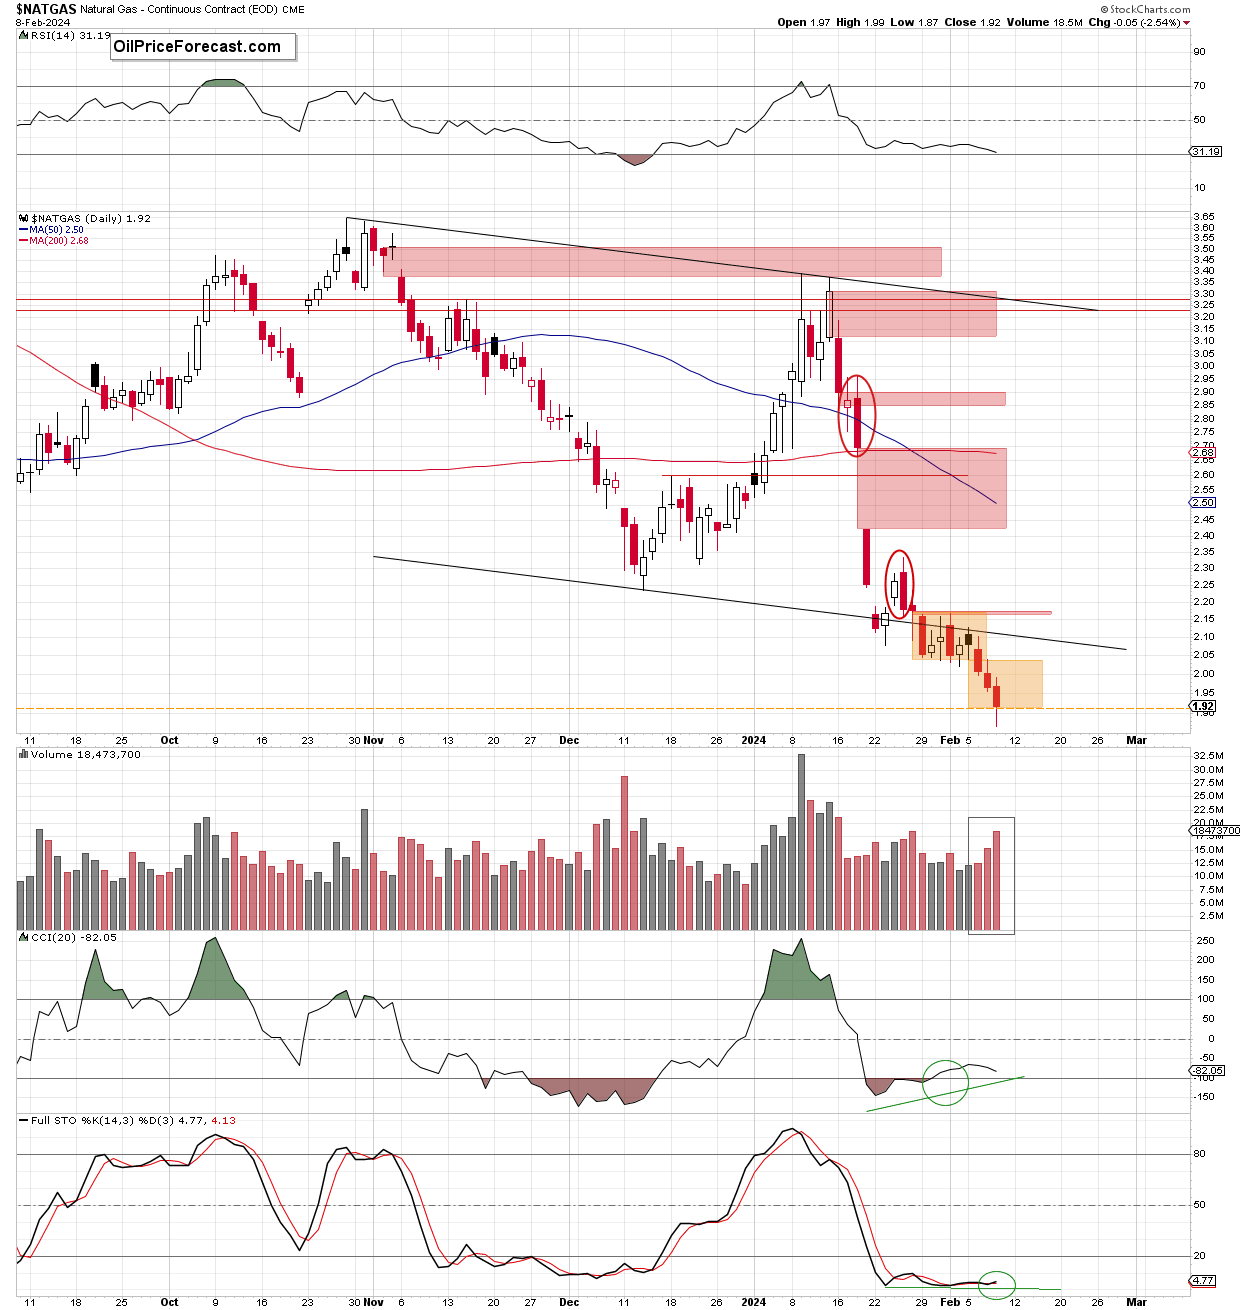
When we take a closer look at the daily chart, we see that although the buyers managed to invalidate a tiny breakdown under the lower border of the orange consolidation last Friday, the previously broken lower border of the black declining channel stopped them on Monday, triggering a pullback.
This show of their weakness, in combination with the earlier price action (described both last week and in earlier articles, which you can read at oilpriceforecast.com), lured the bears and encouraged them to show their claws on the Following session.
Thanks to their attack, natural gas not only slipped under the orange consolidation, but the sellers managed to close the day below it, which (in tune with last week’s assumptions) opened the way to lower levels.
As a result, recent sessions were completely dominated by the bears and the price fell to the lowest level since Sep. 2020.
Are the bulls completely lost and the way to the south is wide open?
Looking at the bearish candles from recent days, two more red gaps (the first one [2.068-2.082] from Tuesday and the second [2.003-2.009] from Wednesday) and increasing volume (which confirms the sellers’ involvement in declines) the situation doesn’t look encouraging – especially when we take into account yesterday’s daily closure under Apr.14, 2023 low.
Signs of a possible reversal emerge
Nevertheless, there are some technical signs that suggest that the room for decline may be limited and a reversal in the coming days is not ruled out.
What do I mean by that? Let’s take a look at the chart below.
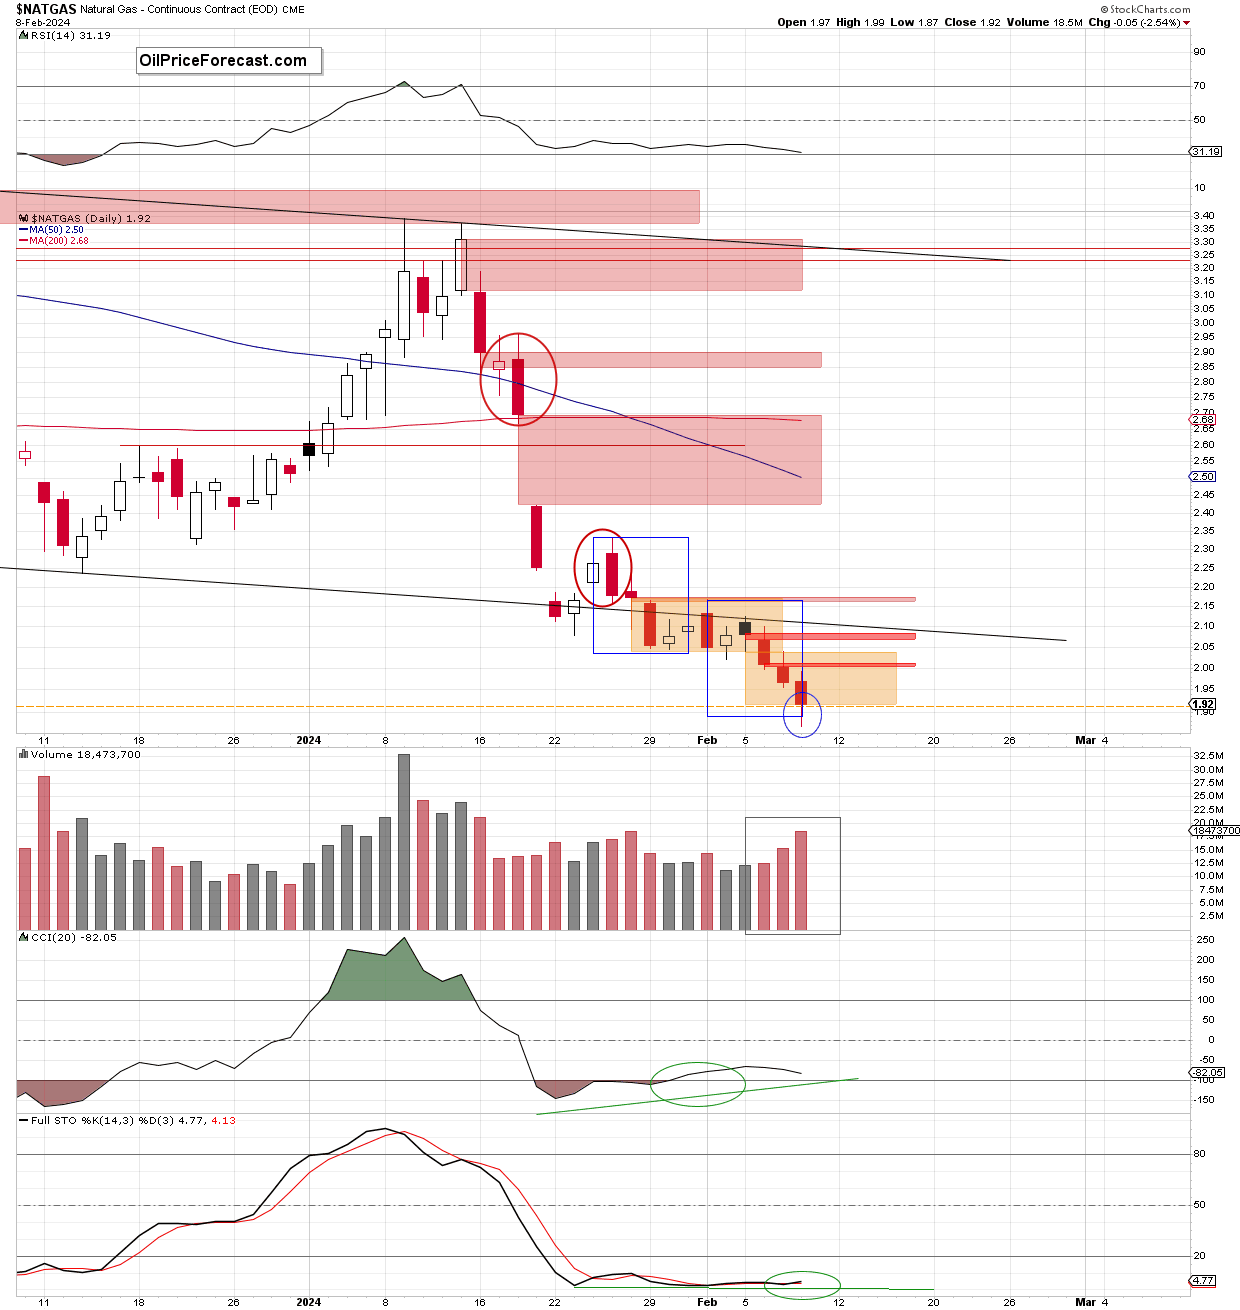
From this closer perspective, we see that the price action from Jan.25 to Feb.8 can be summarized as a flag pattern (as a reminder, this formation has actually worked perfectly on copper [you could read more about it in my article published on Feb.1st] and also on oil stocks in recent days).
As you see, the size of this week’s downward move corresponded to the first part of the formation (both parts marked with blue rectangles), achieving a minimum range of movement, which suggests that the bears may want to take profits in this area – especially when we factor in the strong support marked on the monthly chart – the green supportive gap (1.80-1.86), which serves as the key support for the bulls.
At this point, it is worth nothing, that the first test of this support took place in Sep.2020, but as you see on the long-term chart, it withstood the selling pressure and triggered a rebound, which resulted in further improvement in the following months. Therefore, taking into account the fact that history tends to repeat itself, it seems that we could see a similar price action in the near future (even if the bears test the lower line of the gap first).
Additionally, when we take a closer look at the current position of the daily indicators, we see that there are positive divergences between the CCI, the Stochastic Oscillator, and the price, which in combination with buy signals generates by both indicators suggests that reversal may be just around the corner.
On top of that, when we focus on the weekly volume, we notice that despite subsequent red candles, the volume is decreasing week by week, suggesting that the bears' involvement in deepening the declines is decreasing.
Connecting the dots, if the bulls close ranks and are able to close today's session (and thus the entire week) above Apr.14, 2023 low, the chance of a rebound will increase. If they failed, a test of the lower border of the above-mentioned gap should not surprise us.
Summing up, the buyers’ weakness at the beginning of the week lured the bears, who showed their claws and they implemented the pro-declining scenario from last week. Despite the fresh multi-month low, there are first technical signals on the horizon suggesting that the room for declines may be limited and a reversal may be just around the corner.
If you’d like to know what the current technical picture of crude oil is or to find out what arguments the bulls have or what allies do the bears have, I encourage you to subscribe to Oil Trading Alerts, where you’ll find the answers to these (and many other) questions.
Have a wonderful weekend and see you on Monday.
Want free follow-ups to the above article and details not available to 99%+ investors? Sign up to our free newsletter today!
Want free follow-ups to the above article and details not available to 99%+ investors? Sign up to our free newsletter today!
Author

Anna Radomska
Gold Price Forecast
Anna's passion for drawing evolved into a fascination with colorful lines and shapes, which later inspired her interest in the stock market.