Markets cheer soft US PPI, but there’s a catch
March’s US Producer Price Index rose by much less than expected, with core wholesale inflation slowing sharply and services prices coming in completely flat. However, intermediate demand data tell a more complicated story: price pressures continue to build in the middle of the production pipeline, and the full costs of the Strait of Hormuz disruption, from helium shortages to surging fertilizer prices, have barely begun to show up in the official numbers.
Markets exhaled on Tuesday, when the Bureau of Labor Statistics (BLS) released March's Producer Price Index (PPI), and the headline number came in at 0.5% MoM, well below the 1.2% spike markets had braced for. With West Texas Intermediate crude having pushed above $100 a barrel during March and gasoline surging 15.7% at the wholesale level, there was genuine fear that the Iran war would trigger a broad-based producer price spike.
Instead, the data told a more nuanced story, one that gave bulls a reason to run but should leave the Federal Reserve (Fed) cautious about declaring victory.
The energy shock stopped at the factory gate
The most important takeaway from March's PPI is what didn't happen. Goods prices surged 1.6% MoM, the largest advance since August 2023, driven almost entirely by energy. But services prices printed exactly 0.0%, their flattest reading since August 2025. That divergence, the widest in at least 14 months, is the chart that matters most right now.
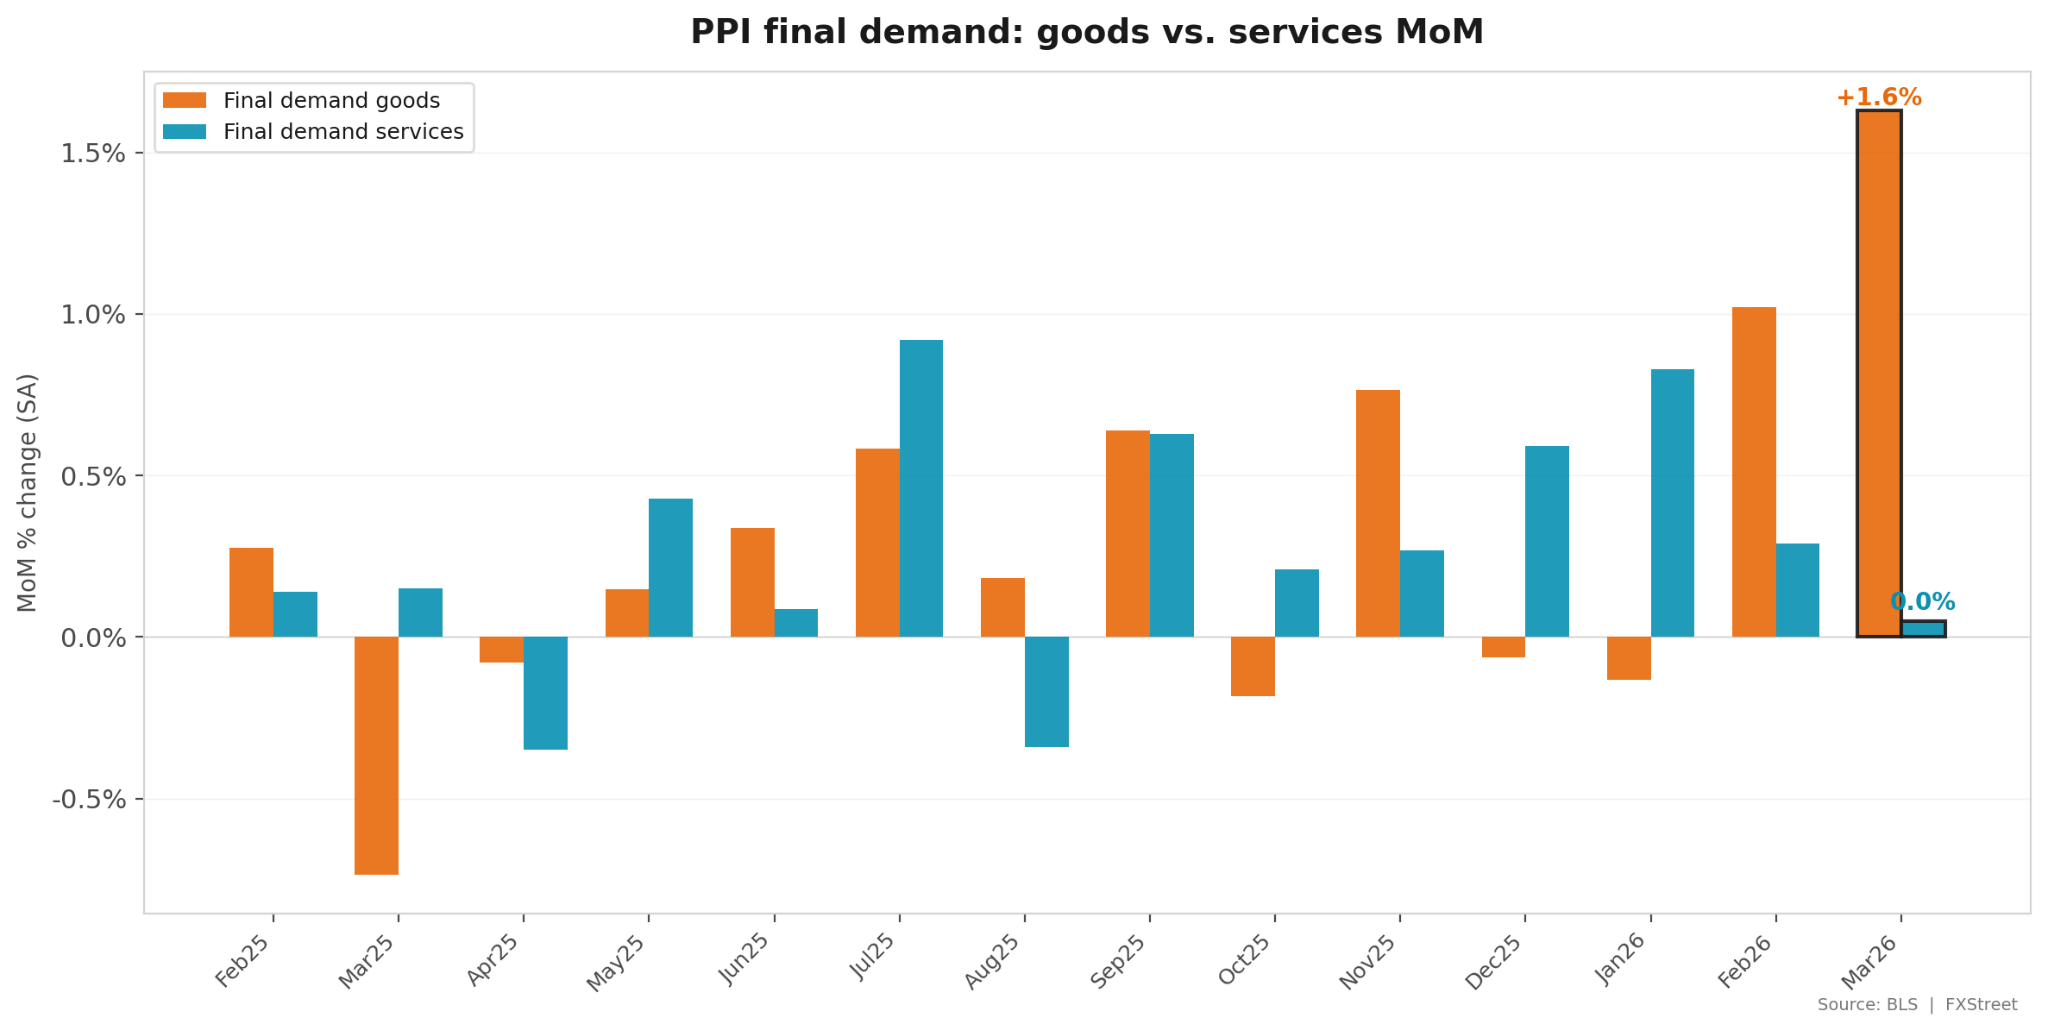
It tells you the Iran war's price shock remains concentrated in energy and its immediate derivatives: gasoline, diesel, jet fuel. It has not leaked into healthcare, financial services, logistics margins, or the other services categories that make up the bulk of the US economy. Core PPI excluding food, energy, and trade services rose just 0.2%, down sharply from 0.5% in both January and February. On a YoY basis, core PPI edged up to 3.6% from 3.5%, but that number has been essentially flat for six months.
Ross Mayfield, investment strategist at Baird, noted that the market "is already pricing in some level of anxiety about Iran" and expressed confidence that the conflict would not extend into the second half of the year. Tuesday's PPI data supports that view, at least for now.
Where is the pressure actually sitting?
Now things get more interesting. The BLS breaks intermediate demand into production flow stages, essentially tracking where prices are moving in the supply chain. In March, Stage 2 (the earliest pipeline, closest to raw materials) actually fell 0.4% after surging more than 2% in February. Stage 3 (mid-pipeline) spiked 1.2%, its biggest monthly jump since August 2023. And Stage 4 (nearest to consumers) rose just 0.3%, cooling from 0.8% in February.
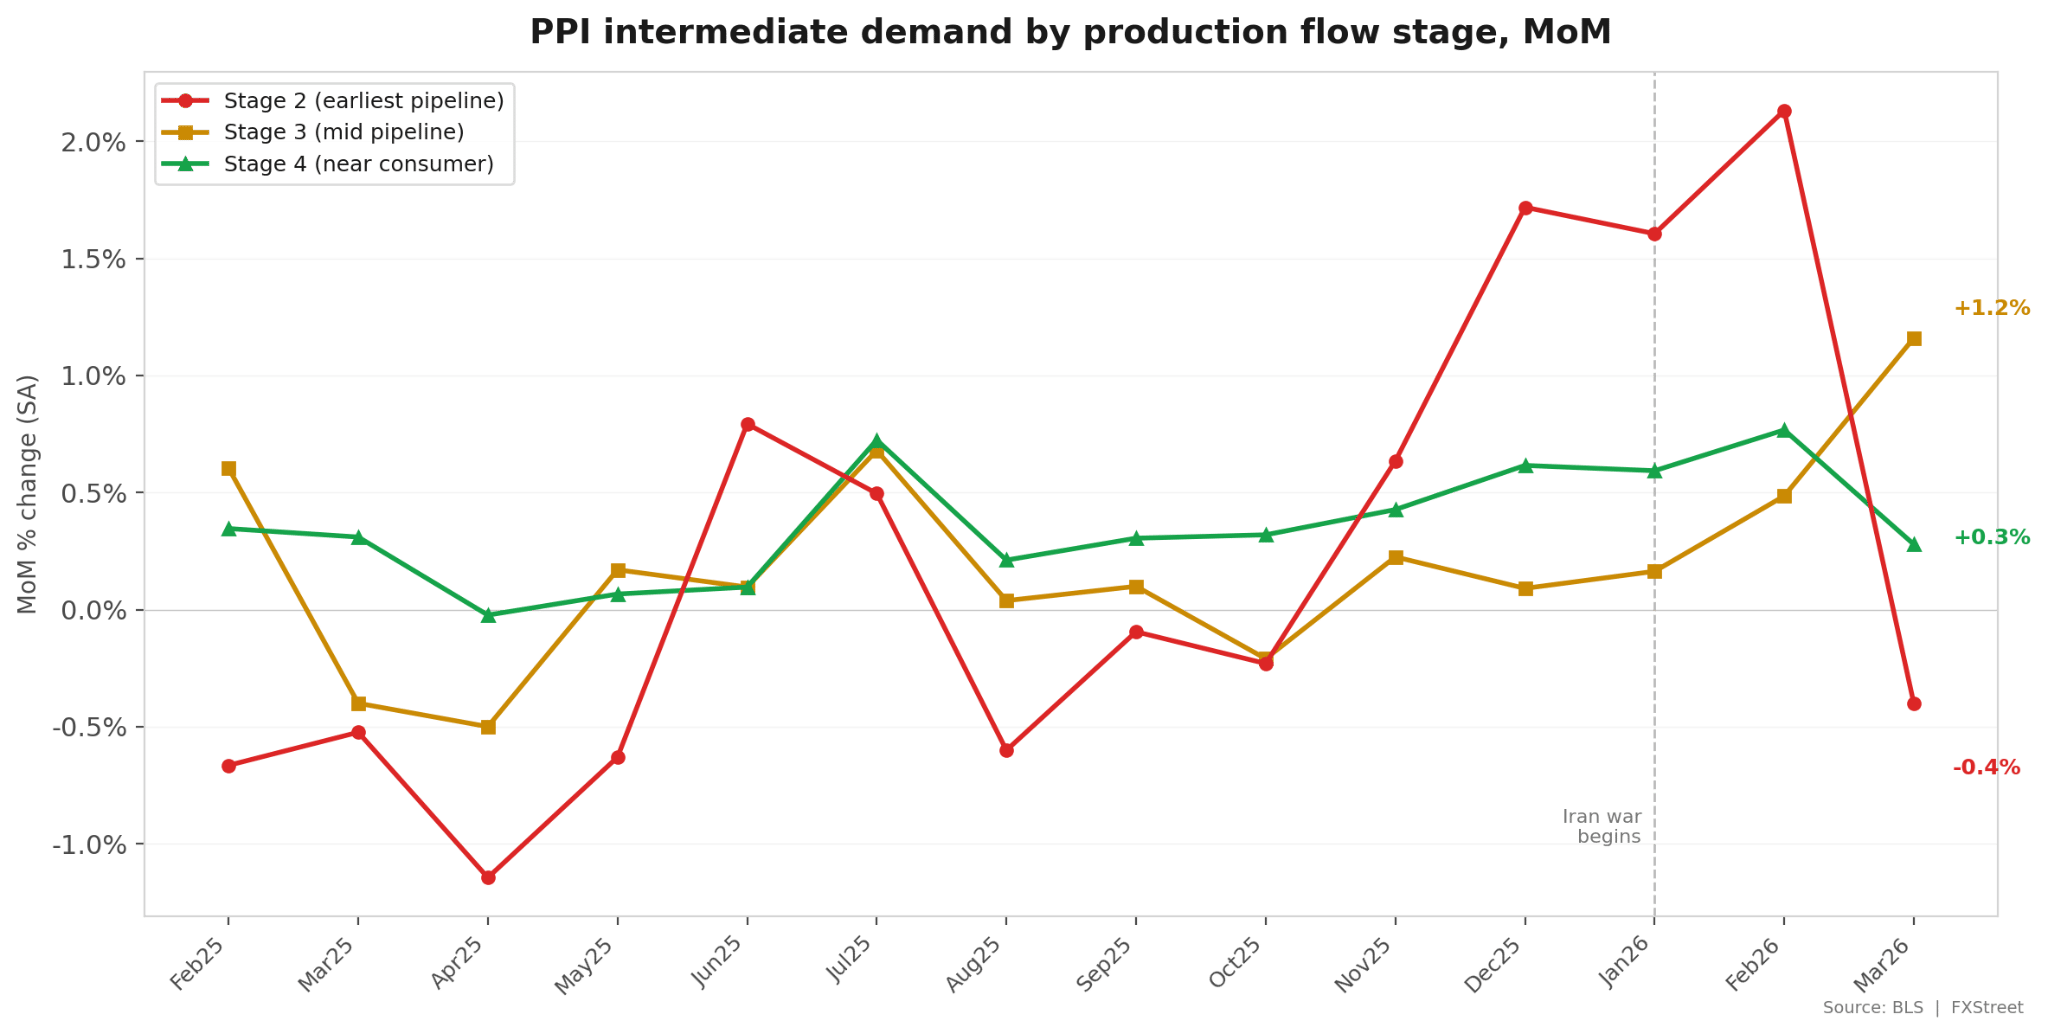
The pattern suggests the initial energy shock that hit raw inputs in December through February is now working its way through the middle of the production chain, but losing momentum as it approaches the consumer-facing end. That is exactly the dynamic you want to see if you are hoping the inflation impulse proves transitory. However, a 1.2% monthly spike at Stage 3 is not something to dismiss, and it could take another one to two months before the full picture of pipeline transmission becomes clear.
What the PPI is not telling you
Tuesday's report captures the damage caused by surging gasoline and diesel prices. But it understates the full scope of the disruption to the Strait of Hormuz. Two commodity markets that transit the strait in large volumes, helium and fertilizer, are under severe stress but barely register in the headline PPI figures.
Roughly a third of the world's commercial helium comes from Qatar, and the strait's closure has taken an estimated 27% of global supply offline. Spot helium prices surged 70% to 100% in the weeks following the blockade, according to industry consultant Phil Kornbluth. Because helium trades overwhelmingly on long-term contracts, the price spike has not yet fed through to downstream buyers. But semiconductors are now the largest end-use for helium, and chipmakers face the prospect of supply allocations and force majeure declarations from industrial gas suppliers if the disruption persists. Even after a ceasefire, restarting Qatar's damaged Ras Laffan facilities could take weeks to months.
Fertilizer is the other hidden pressure point: roughly 30% of globally traded fertilizer transits the Strait of Hormuz, and for urea specifically, roughly two-thirds of seaborne supply passes through the chokepoint. Retail urea prices jumped 12% in a single month to $674 per ton by mid-March, with some spot markets reporting prices above $800 per ton. The American Farm Bureau Federation urged the Trump administration to reopen the strait, warning of a potential crop shortfall. The USDA's March Prospective Plantings report already showed farmers pivoting from corn to soybeans because nitrogen costs reached approximately $166 per acre, a level that makes corn planting uneconomical for many producers. That shift, if sustained, could show up in food prices later in the year.
Neither of these pressures will be prominent in PPI until contract renegotiations force price adjustments throughout the supply chain. They are, in effect, the costs that the headline number is not yet capturing.
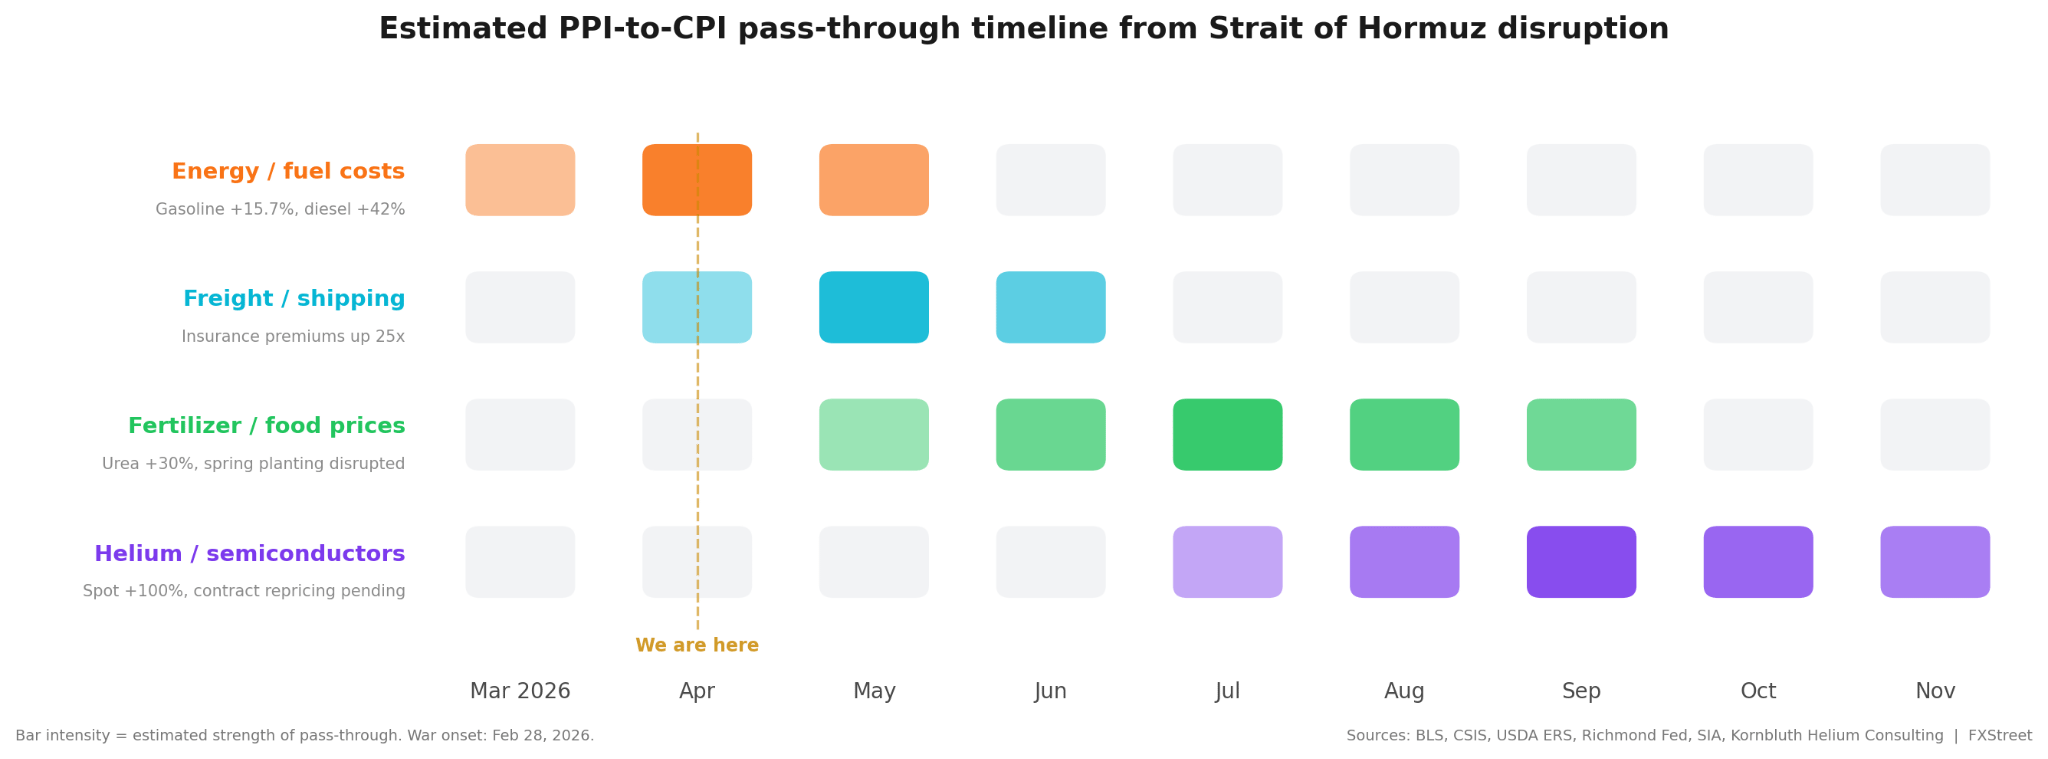
Energy's pass-through to consumer prices is already well underway and likely peaking in April. Freight and shipping cost increases are arriving now, with war-risk insurance premiums running roughly 25 times pre-war levels. Fertilizer's impact on food prices is the summer problem: the spring planting decisions being made right now at inflated nitrogen costs will not translate into higher grocery bills until harvests come in between July and September. And helium's effect on semiconductor pricing is the longest fuse of all, unlikely to surface in consumer-facing electronics costs before the fourth quarter, if it surfaces at all, given that the ceasefire may resolve the supply crunch before contract repricing kicks in.
Can the pipeline hold?
The optimistic read on March's PPI is straightforward: the energy shock is real but contained, core inflation is decelerating at the wholesale level, and services pricing power has stalled. All of that gives the Fed room to remain patient and supports the equity market's recent rally back toward all-time highs.
The cautious read is that intermediate demand Stage 3 just printed its hottest reading in over two years, helium and fertilizer costs are building outside the official data, and gasoline prices may not have peaked in the March survey window. The BLS acknowledged that the PPI "probably missed some of the gasoline price gains late in the month," and Continuum Economics noted that further energy strength is likely in April.
With a second round of US-Iran negotiations reportedly under discussion and Oil prices pulling back sharply on Tuesday, the market is betting the pressure will ease before it reaches consumers. But if ceasefire talks stall or the strait remains partially blocked through the spring planting season, the costs hiding in the pipeline could make the next few PPI readings considerably less comfortable.
Author

Joshua Gibson
FXStreet
Joshua joins the FXStreet team as an Economics and Finance double major from Vancouver Island University with twelve years' experience as an independent trader focusing on technical analysis.

















