July market outlook: Elev8 broker’s view on Gold, Bitcoin and Brent

We continue our regular Traders Outlook series, delivering mid-term perspectives on selected financial instruments to help traders grasp the broader market picture and position their CFD strategies effectively for the month ahead. In this edition, we examine gold (XAUUSD), Bitcoin (BTCUSD), and Brent crude oil (XBRUSD).
Macro environment
As June draws to a close, it is worth reflecting on the key events that shaped and moved the markets. Arguably, the most important development of the month was the ceasefire agreement between the United States and Iran. Its announcement triggered a textbook risk-on move: the U.S. dollar weakened while the NASDAQ climbed to a fresh all-time high. Predictably, the geopolitical risk premium in crude oil benchmarks faded sharply, sending both WTI and Brent to multi-month lows.

Yet the initial optimism was quickly replaced with a more sober assessment. Traders realised that the announced ceasefire is a preliminary step rather than a durable peace accord, with protracted and potentially bumpy negotiations still ahead. At the same time, damage to oil supply infrastructure has already occurred and cannot be undone instantly, meaning the risk of sticky inflation is still on. As a result, monetary policy expectations have not turned as dovish as many had hoped before the conflict. Markets are now pricing in a noticeably more hawkish stance from global central banks. There is currently a 49% probability of a 25 bp rate hike by the Federal Reserve (Fed) in September, a 48% probability for the similar move by the European Central Bank (ECB), and a 46% probability for the same move by the Bank of Japan (BoJ) in October.
In this environment, XAUUSD reversed its post-ceasefire gains and moved lower, briefly dropping below the $4,000 mark. Bitcoin stayed firmly in a bearish trend, breaking below the psychologically important $60,000 level, while the U.S. dollar index climbed back above the key 100.00 threshold. What does this imply for the month ahead?
Gold (XAU/USD)
The underlying fundamentals for bullion have grown increasingly challenging. Interest-rate swap markets currently assign zero probability to a Fed rate cut over the next six months. Although the Fed left policy rates unchanged on 17 June, officials made clear they anticipate higher borrowing costs later in the year amid inflation that remains above the 2% target. The U.S. dollar index (DXY) rose 0.85% on the news. On 24 June, DXY reached 101.80, a five-week high, while gold moved inversely, briefly slipping below $4,000 per ounce.
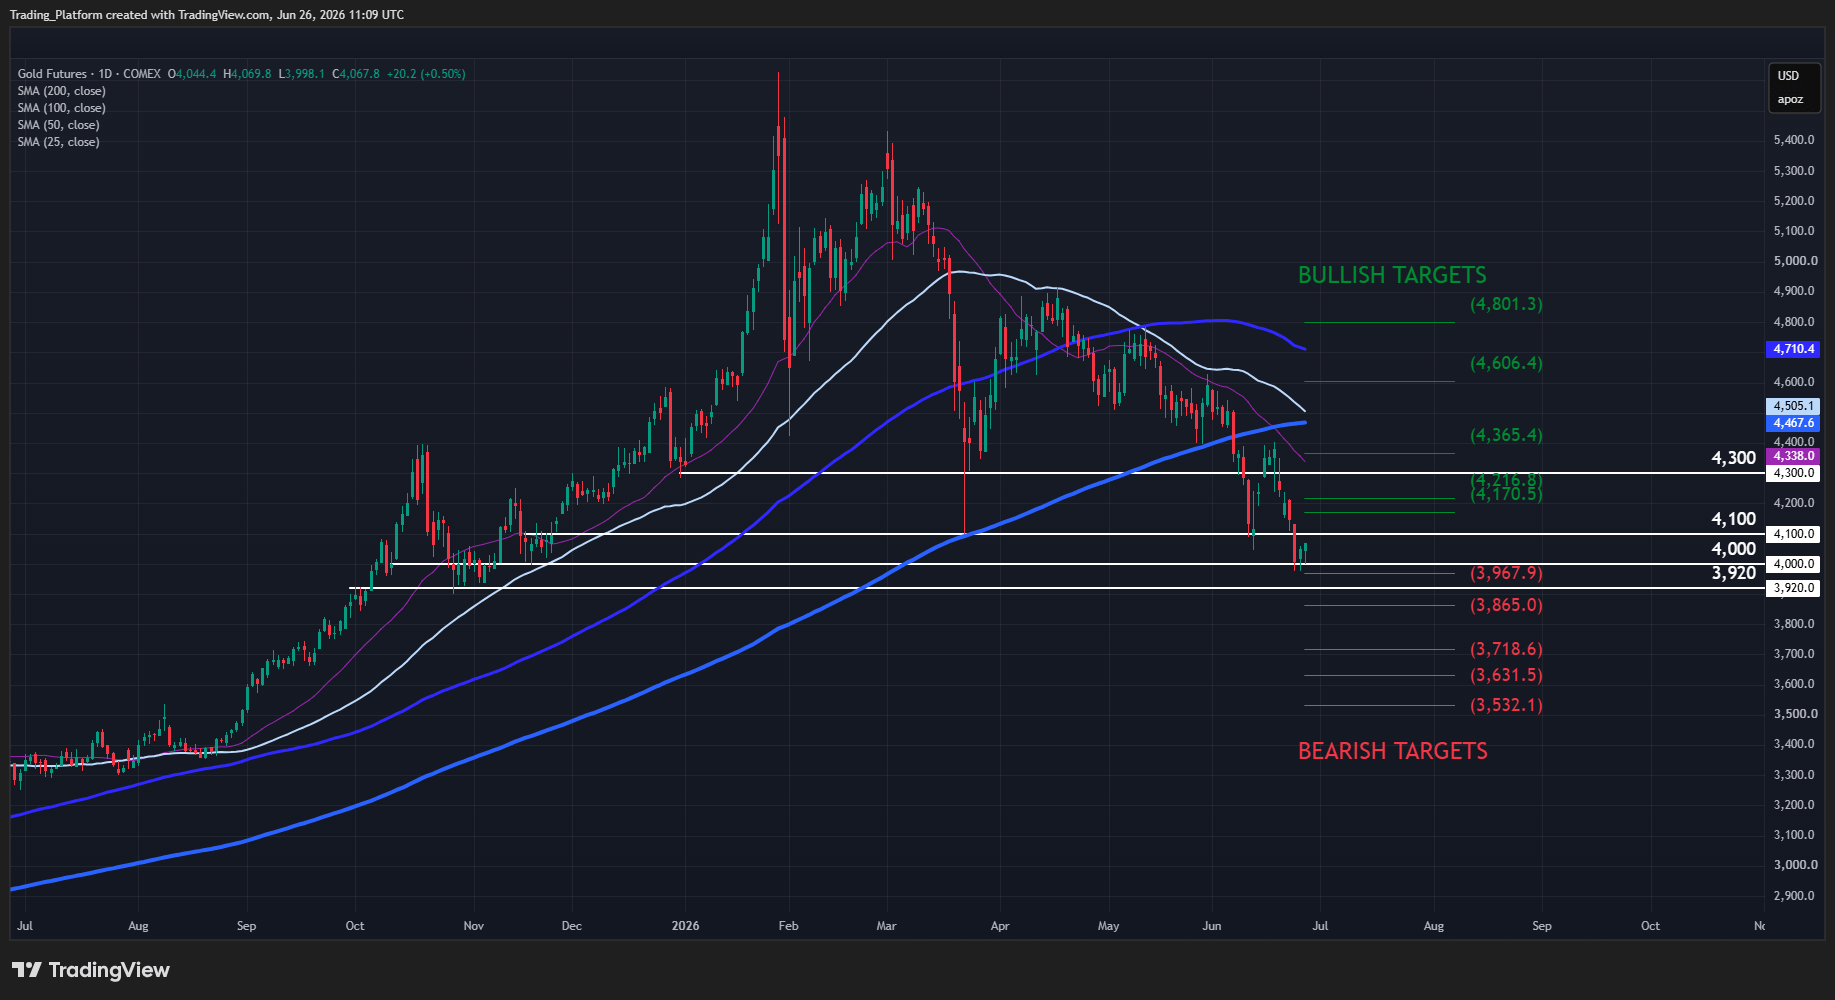
From a technical standpoint, a major regime shift occurred on 5 June when gold slipped below its 200-day moving average for the first time in nearly three years. Critically, the subsequent relief bounce failed to even retest this moving average from below, confirming its transition from long-term support to formidable resistance. The metal is now trading near seven-month lows. Even though the latest U.S. Personal Consumption Expenditures (PCE) inflation print came in line with expectations, the rebound in gold was muted, a clear sign of a structural bearish trend.
Still, the $3,980–$4,000 area appears to be offering some temporary support for now. A break above the descending trendline on the hourly chart could open the way toward $4,100. However, only a sustained move above $4,400 would invalidate the underlying structural bearish bias in the mid term. Central-bank buying of physical gold remains active and should limit the scope for an accelerated sell-off in July, unless global monetary-policy expectations turn even more hawkish. Consequently, traders should prepare for a protracted period of range-bound price action between $3,900 and $4,250.
Gold (XAU/USD) daily chart
Source: TradingView, Elev8 broker
Bitcoin (BTC/USD)
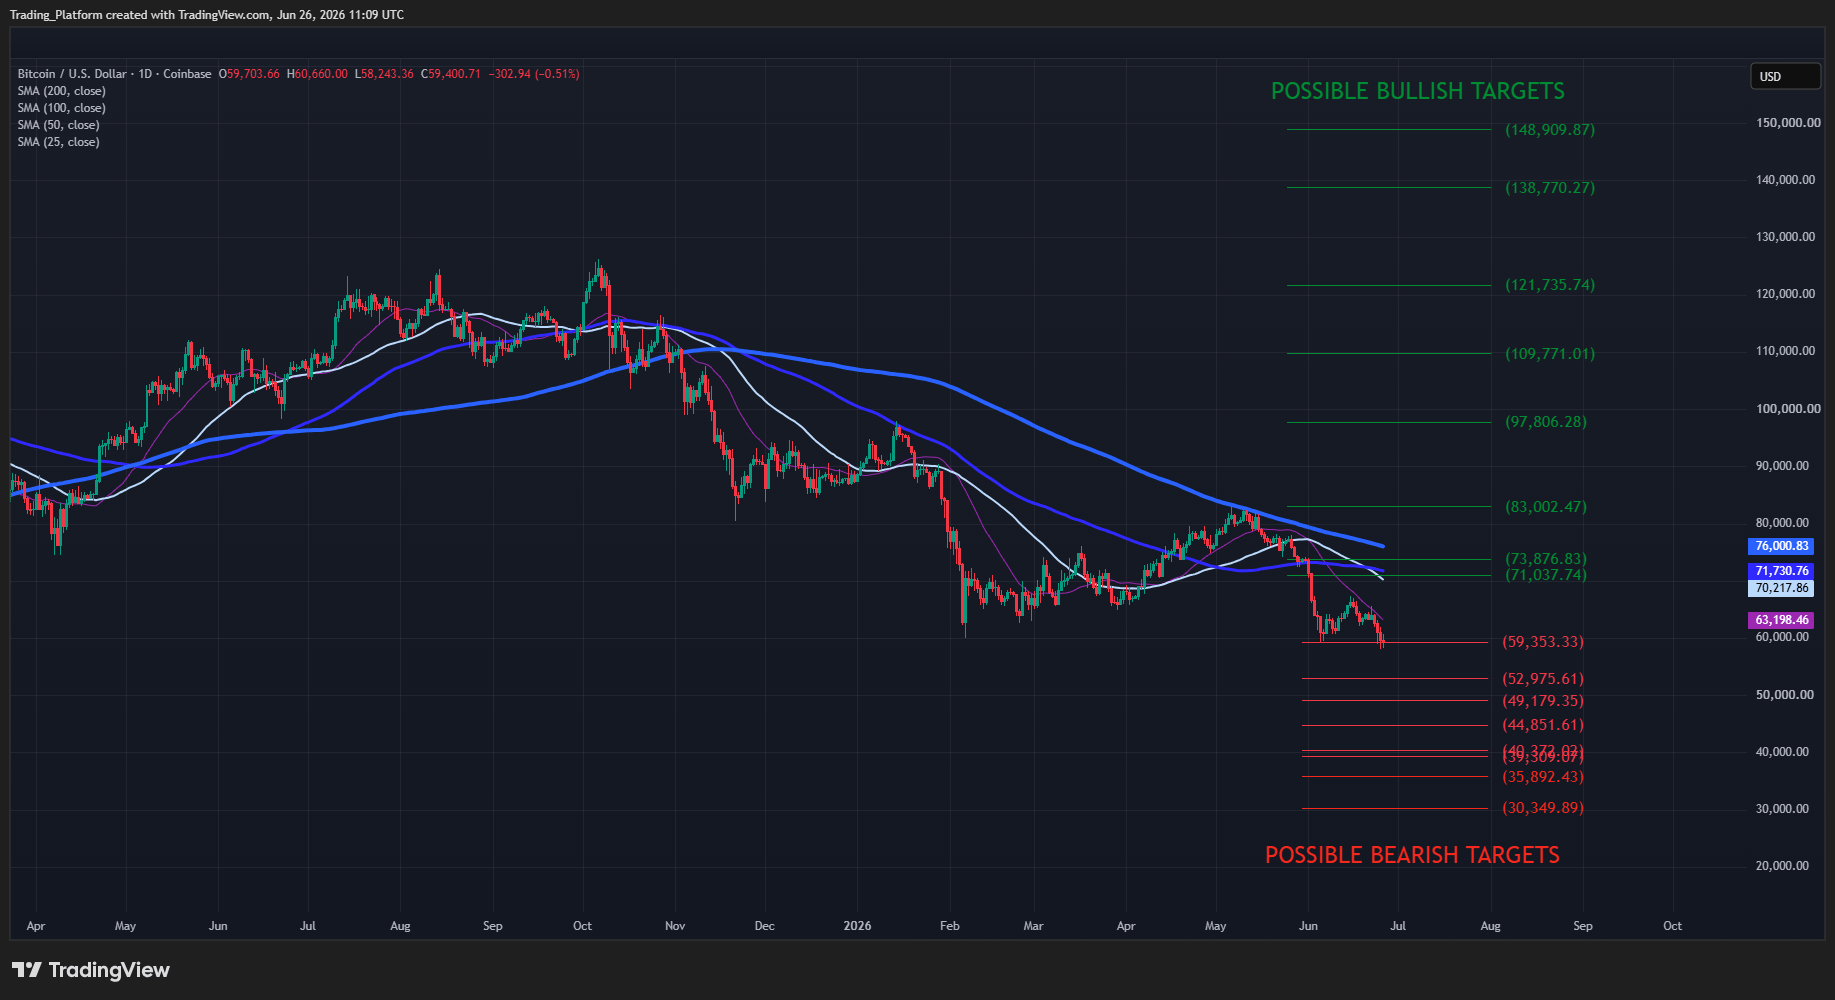
It has been a while since the world's primary cryptocurrency has been in such a dismal state as it is now. Bitcoin has now lost more than half of its value since reaching the record high last October. As the price sliced through critical technical levels, algorithmic selling and margin calls intensified the downward pressure. Since mid-June, the cryptocurrency has fallen 10.8%, driven primarily by broad U.S. dollar strength. BTCUSD is now trading below all major daily moving averages and has yet to find convincing support. The next meaningful downside target is the $50,000 level, which could ultimately act as a significant long-term floor by attracting buyers and deterring further selling.
As with gold, the dominant bearish catalyst for bitcoin remains the shift toward more hawkish U.S. monetary policy expectations amid persistently elevated inflation. The economic fallout from the Iran conflict has not produced any meaningful slowdown in the U.S. economy. Q1 GDP expanded 2.1% year-over-year, core durable goods orders rose 1.3% in May, and weekly jobless claims printed at 215k, comfortably below expectations. These data points reinforce the possibility that the Fed may indeed hike rates later this year. Expectations for multiple rate cuts in 2026, which were aggressively priced in earlier, have largely evaporated.
Overall, the crypto market appears fundamentally mispositioned, with speculators placing bullish bets in a structurally bearish market. Indeed, more liquidations may be ahead as we haven't yet seen the volume spike that normally accompanies panic sales. Thus, new lows in BTCUSD may yet be reached.
In the short term, BTCUSD may rebound toward $65,000, but only a sustained advance above $76,000 would invalidate the underlying structural bearish trend. Traders should remain alert to a possible break below $59,000, which would open the path toward the $50,000 zone.
Bitcoin (BTC/USD) daily chart
Source: TradingView, Elev8 broker
Brent (XBR/USD)
Oil and gas flows have been disrupted since the joint U.S.–Israeli actions against Iran began at the end of February. The recent ceasefire, however, has allowed traffic to resume through the strategically vital Strait of Hormuz. Optimistically, crude oil benchmarks Brent and WTI have now almost returned to the pre-conflict levels, as if supply risks have suddenly disappeared, which is clearly not the case. Indeed, on Thursday, 25 June, a cargo vessel reported an attack by an unidentified projectile while transiting the Strait of Hormuz near the Omani coast. The incident led the United Nations International Maritime Organization to suspend its efforts to shepherd vessels through the strait, reviving fears that the preliminary agreement may not hold and reawakening concerns about global oil supply security.
For oil traders, the most important theme remains the opaque negotiations between Iran and the United States. U.S. President Donald Trump warned earlier this month that failure by Iran to honour the agreement could prompt a return to military action. Meanwhile, Iran's Persian Gulf Strait Authority has stated that vessels outside the routes it designates will not be guaranteed safe passage.
Still, on the face of it, supply has normalised in the short term. However, structural headwinds persist and may have a bullish impact on the crude oil market in the long run. Firstly, U.S. crude oil production has reached a major long-term peak and is likely to stay flat or decline gradually from here. Output has failed to set a new record for 32 consecutive weeks. Secondly, the U.S. Strategic Petroleum Reserve stands at an estimated 331.2 million barrels, the lowest level since the early 1980s. Replenishing it will take years, if not decades.
Global refined-product inventories also remain tight. According to Bluegold Trader, stocks across the five major hubs (Amsterdam, Antwerp, Rotterdam, Fujairah, and Singapore) rose by just 0.91 million barrels week-over-week to 75.52 million barrels for the week ending 19 June. The annual deficit narrowed only marginally to 33.07 million barrels and remains large by historical standards. These inventory dynamics, combined with subdued U.S. production growth, suggest that any renewed supply disruption could rapidly translate into upward price pressure, underscoring the fragility of the current market equilibrium.
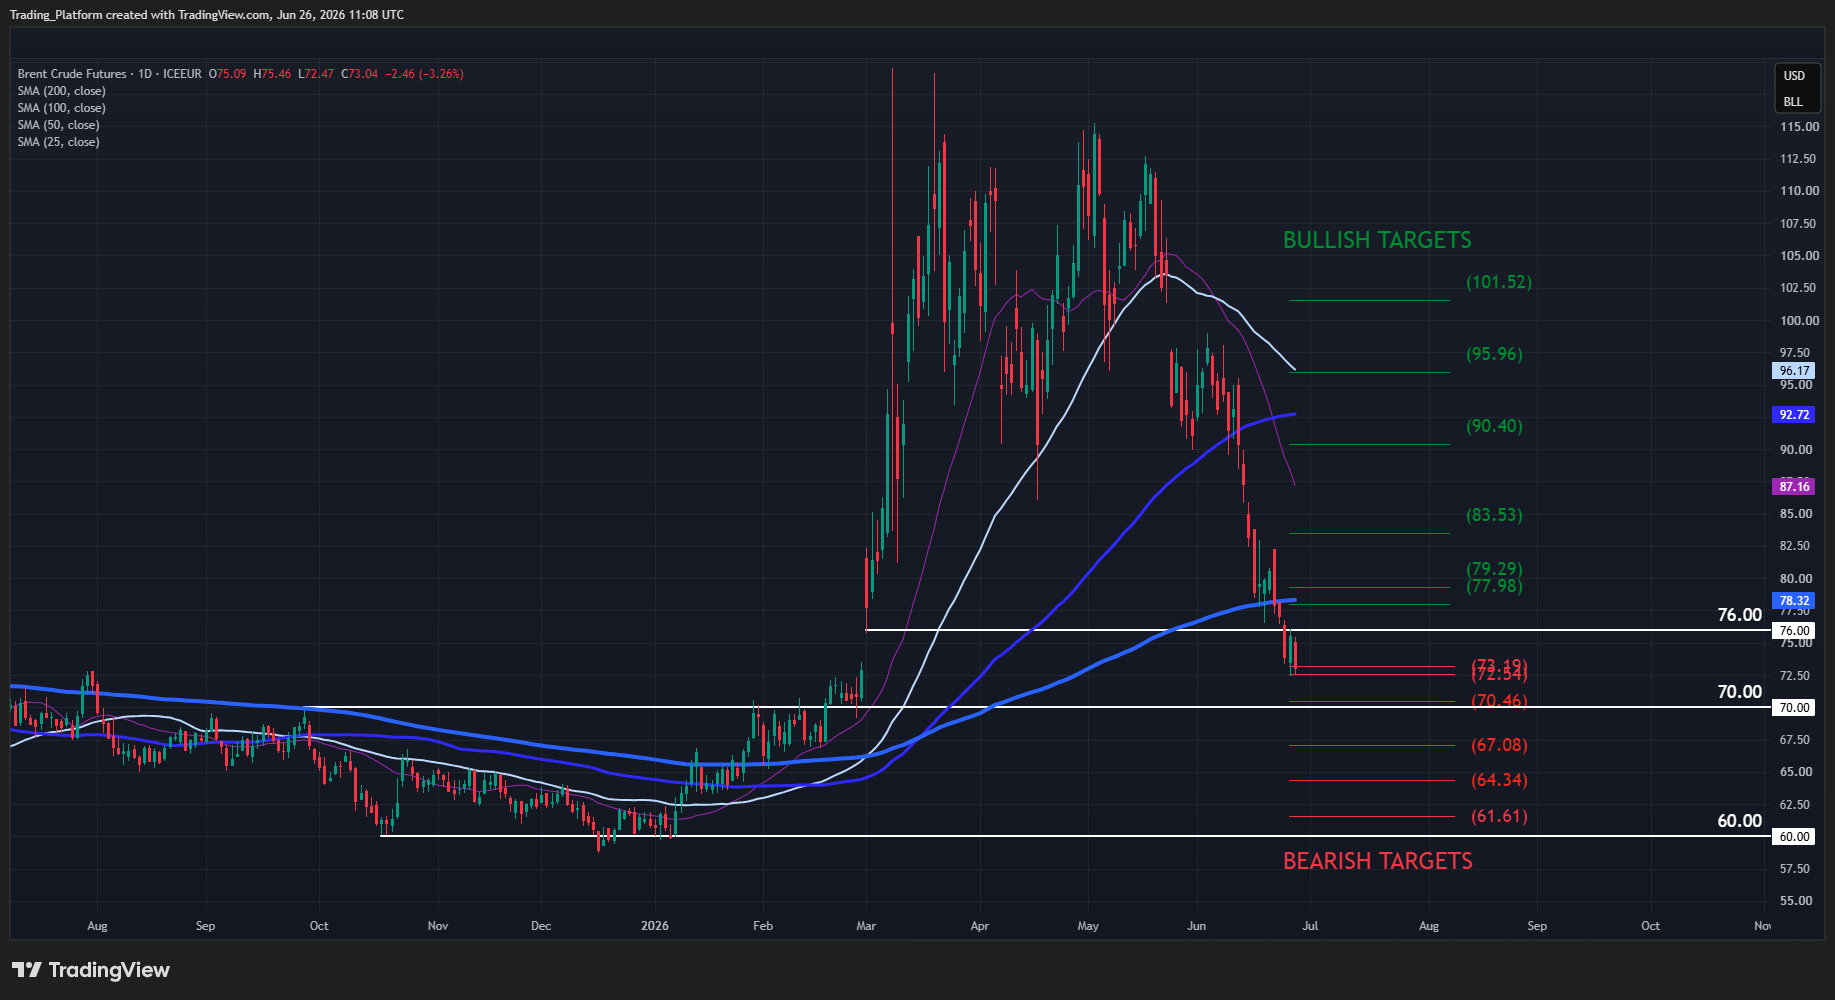
Technically, Brent crude exhibits a bearish bias. The nearest and most obvious target is the $70.00 handle. A break below this level would open the way toward $64.34. While a technical rebound toward $80.00 remains possible, only a resumption of hostilities in the Middle East or a supply shock elsewhere would justify a more meaningful recovery. As long as XBRUSD remains below $80.00, short positions are preferable.
Brent (XBR/USD) daily chart
Source: TradingView, Elev8 broker
Author

Kar Yong Ang
Elev8
Over 10 years of experience in financial analysis and trading. Initially started as a trader and transitioned to analytical roles, specializing in technical analysis and market trend forecasting.

















