Headlines: Things are going up and down

Oil
Massive moves in USD/Asia as the MOF continues to pepper USDJPY and Axios continues to report on progress towards an Iran deal. It’s very hard not to be cynical about these reports, but the market trades every single one of them, so you cannot ignore them either. However you slice and dice the probabilities on the Iran endgame, the reactions to the news are so large that there is no point in questioning the veracity of the news flow.
My USDCHF long has been crushed as the USD sells off aggressively with oil down huge today. USO (the oil ETF) is trading off 11% right now as the attacks on the UAE on Monday got the market prepped for a topside breakout that never came.
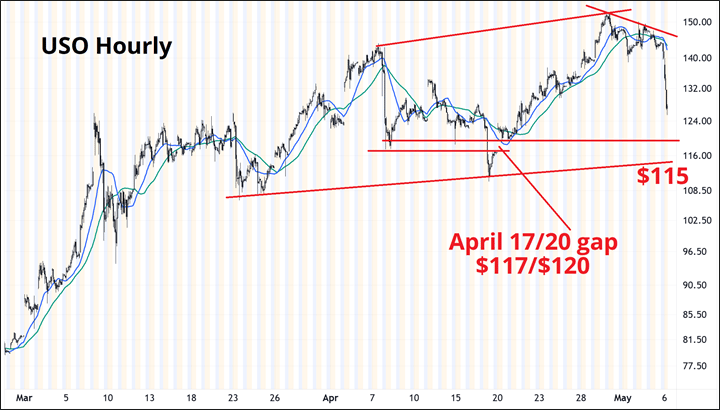
You can see there is still a fair bit of open air before we find any support in crude. I am using USO here, but all the oil futures contracts look roughly similar. The renewed optimism around the end of kinetic hostilities in the Middle East has lit a fire under the AI Capex favorites, but that is not generating much USD demand as the MOF weighs and fears of ECB and other central bank rate hikes into stagflationary economic weakness recede
Apparently, the launch of the DRAM ETF was NOT the peak for memory stocks (!).
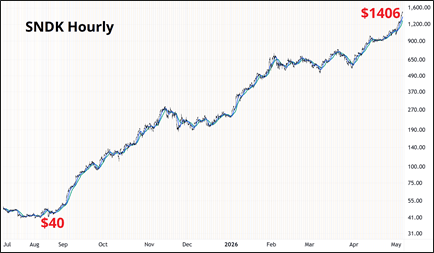
Sandisk is now a 35-bagger in one year as it’s moved from $40 to $1400 in 12 months.
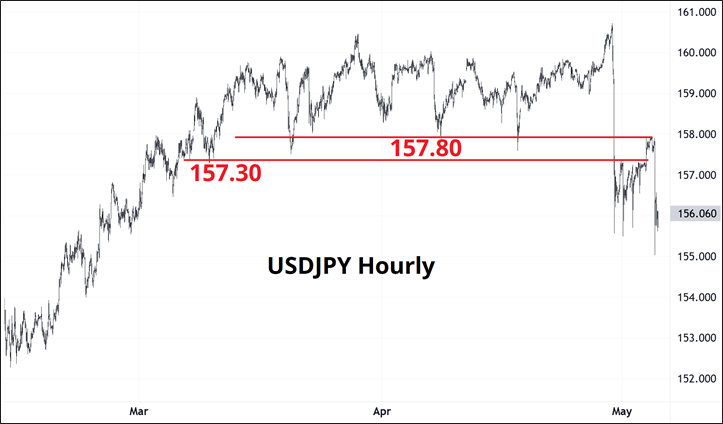
USD/JPY
Interesting chart in USDJPY. Sadly, my original plan to sell from 157.19 to 157.94 for truncation of topside by the MOF was the right play, but I was badly flummoxed by a conflicting view that nonfarm payrolls are likely to come in strong. I suppose I should have worried about that on Thursday, not Monday. You can see that the prior zone of major lows (157.30/157.80) remains resistance and it’s reasonable to think that the MOF is serious as they keep coming back.
Here’s the 5-minute. It’s not clear every single one of those spikes lower was the MOF, but several probably are.
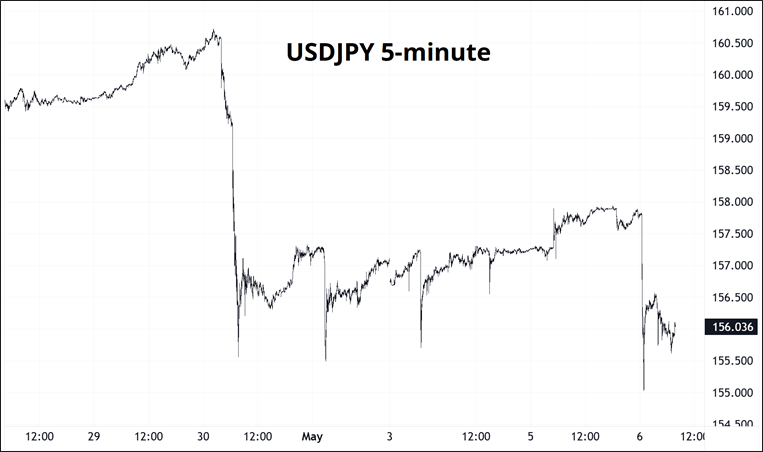
I will leave it alone for now as long makes no sense, regardless of your NFP view, and short at the bottom of range also makes no sense. The MOF now needs to keep lurking above 157.50 as they pray for lower yields and lower oil.
With VIX at 16.4 and oil down 10%, I suppose the hawkish Trump mean reversion trade is the positive EV play (buy oil, buy USD), but there is no timeline for the latest concept of a deal / MOU and so I am not sure how you risk manage long oil or similar trades here. I am thus on the sidelines, recognizing I made a mistake thinking about NFP so soon, or at all. With oil and MOF dominating FX, I feel a bit stupid about focusing on NFP four days before it lands.
Extrapolate this
In recent weeks, the idea of a 50/50 barbell trade featuring semis and oil has become popular as various bank strategists and Substackers have been discussing it as a feasible replacement for the standard 60/40 stocks/bonds risk parity setup. This 50/50 trade has performed extremely well, in hindsight, and has some nice features. It mostly ignores the U.S. consumer and is somewhat impervious to stagflationary concerns and financial conditions. I am not disparaging the idea, but thinking it will work going forward feels like unholy extrapolation. These next two charts take a simplistic approach, comparing 100*XLE + SOX to the Advance Research Risk Parity Index (RPARTR). There are many risk parity indices; I picked this one because the data goes back to 1998. The methodology I am using here is simple, but a more complex methodology will yield similar-looking results.
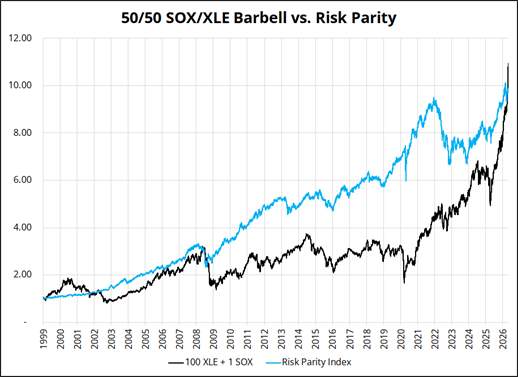
You can see how the SOX+XLE barbell started to outperform after Russia’s latest invasion of Ukraine and held in as oil repriced lower post-Ukraine because ChatGPT started the AI Capex revolution. I find it hard to believe that after two wars and three years of pricing in LLMs that the risk/reward on this thing remains good. But let’s see!
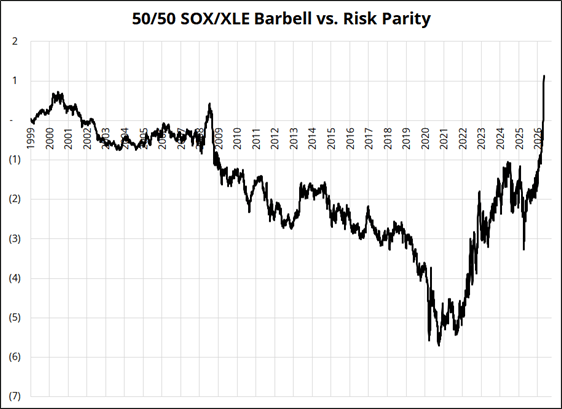
You can see that standard risk parity outperformed on almost all time horizons, except the last few years. The chart at right shows both series indexed to January 1999 = 1 while the second chart shows the difference between the two indexed series.
Something to consider.
Final thoughts
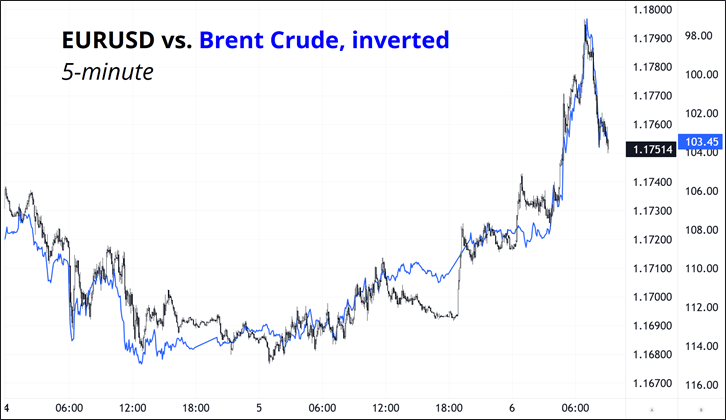
1. EURUSD is crude.
2. Look who started for the Cardinals on May 3. #3, Dustin May.
Author

Brent Donnelly
Spectra Markets
Brent Donnelly is the President of Spectra Markets. He has been trading currencies since 1995 and writing about macro since 2004. Brent is the author of “Alpha Trader” (2021) and “The Art of Currency Trading” (Wiley, 2019).


