Hawkish Fed, strong Dollar push Gold to third straight weekly drop
- Gold fell for a seventh straight session, down over 6% this week. As Middle East-driven oil and gas gains raised inflation risks and reduced near-term rate-cut odds, with ETF outflows pressuring prices despite strong retail buying of physical gold.
- US oil stayed high after slipping from $100/barrel. Stocks and bonds recovered modestly as Israel helps reopen the Strait of Hormuz, and the US authorized delivery and sale of some Russian crude.
- Gold’s post-war slide echoes its mid-2022 drop after Russia’s invasion sparked an energy shock. Although precious-metal volatility has eased since January’s extremes. swings have deterred some haven-seeking investors.
- Gold-backed ETFs have seen persistent outflows recently, pressuring prices—reflecting Western retail and institutional use—and highlighting how ETF demand is especially sensitive to interest-rate shifts.
- The Fed held rates steady Wednesday, in line with expectations, and officials still expect just one 25-basis-point cut for the rest of the year.
- Interest-rate futures and the CME FedWatch show traders see little chance of a Fed rate cut this year.

Gold climbed Friday on technical buying but was on track for a third straight weekly loss as a firm dollar and a hawkish Fed curbed near-term rate-cut hopes.
Spot gold gained 0.85% to $4,692.45/oz at 06:22 GMT, bouncing back from a near two-month low hit earlier.
Gold is seen as an inflation hedge, but high rates favor yield-bearing assets, and a stronger dollar raises bullion's cost for holders of other currencies.
Current Target Rate = 3.50 - 3.75
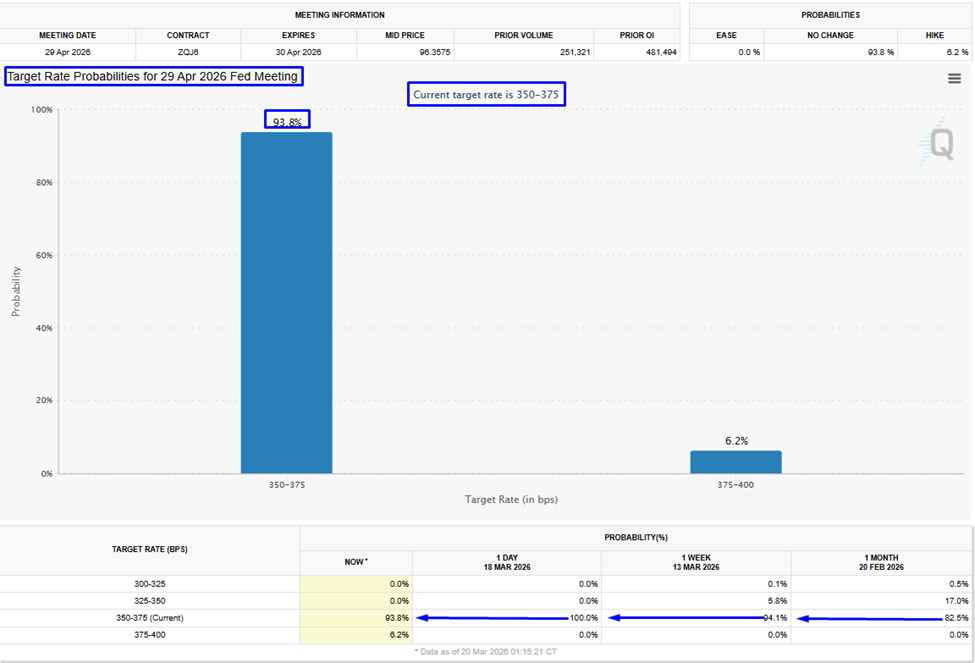
- CME FedWatch April no rate change probabilities have moved higher to 93.8% now from 82.5% on February 20, 2026.
Fed rate probability
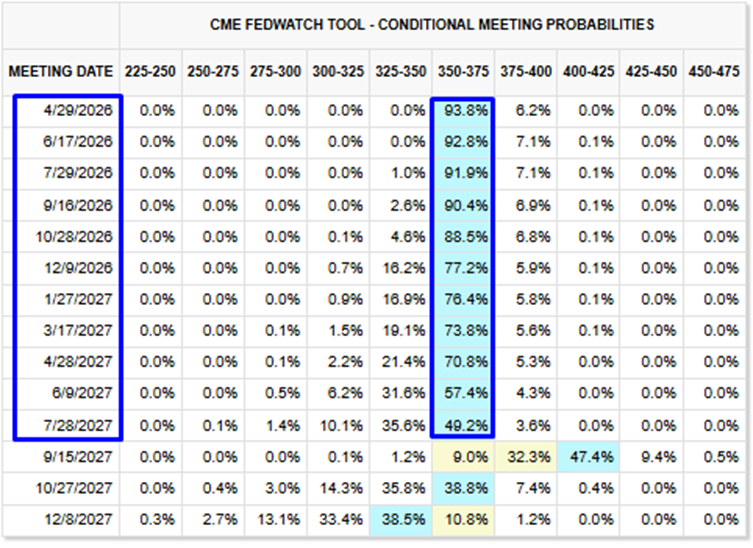
- CME FedWatch latest Fed rate probability points at no rate cut until mid-2027. What a change!!!
Technical analysis perspective
Gold/US Dollar:
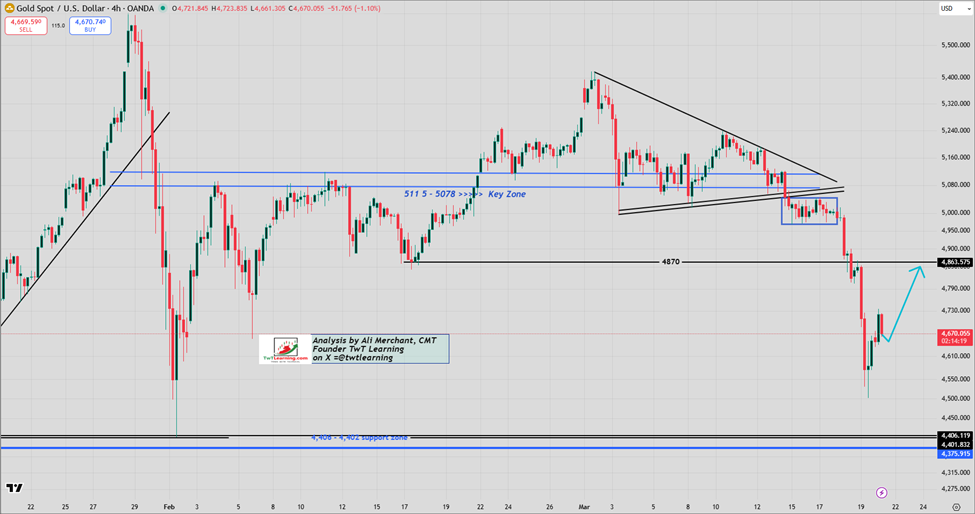
- Spot gold tumbled as flagged in our March 17 research, breaching $4,870 and dropping to a $4,502 low yesterday.
- Prices rebounded sharply into a corrective rally to relieve oversold momentum.
- The metal is slowly climbing back toward $4,870 but the move could be two-way, dipping to $4,660–$4,650 before resuming higher.
- A sustained break below $4,570 would invalidate the upside correction, targeting $4,550 and the $4,502 low.
Gold 4 hourly chart:
Gold/Silver Ratio:
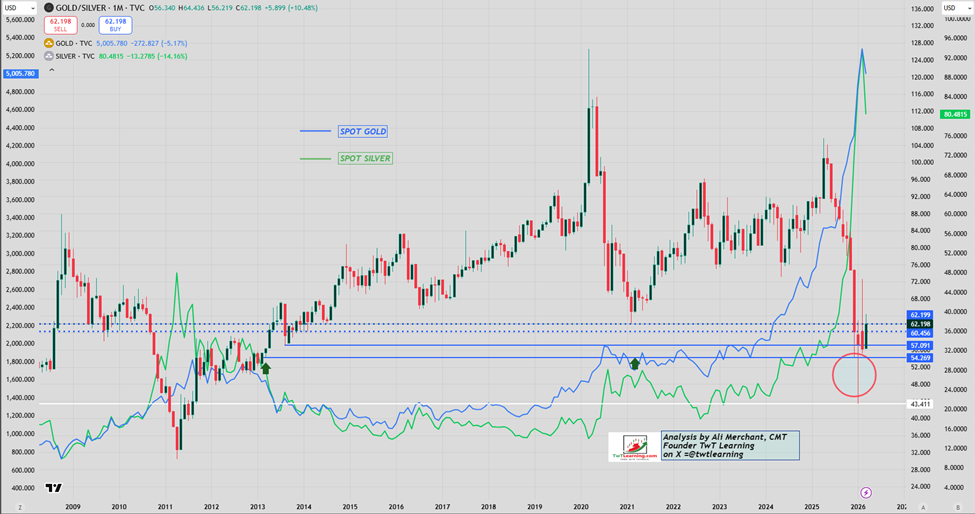
- The gold–silver ratio shows how many ounces of silver buy one ounce of gold (gold ÷ silver), a key measure of relative value.
- The ratio is trading in a 56–69 range, inside February monthly range implying range-bound action for both metals after a huge sell-off this week.
- A rising ratio typically signals relative weakness in both metals.
Gold/Silver Ratio Monthly chart:
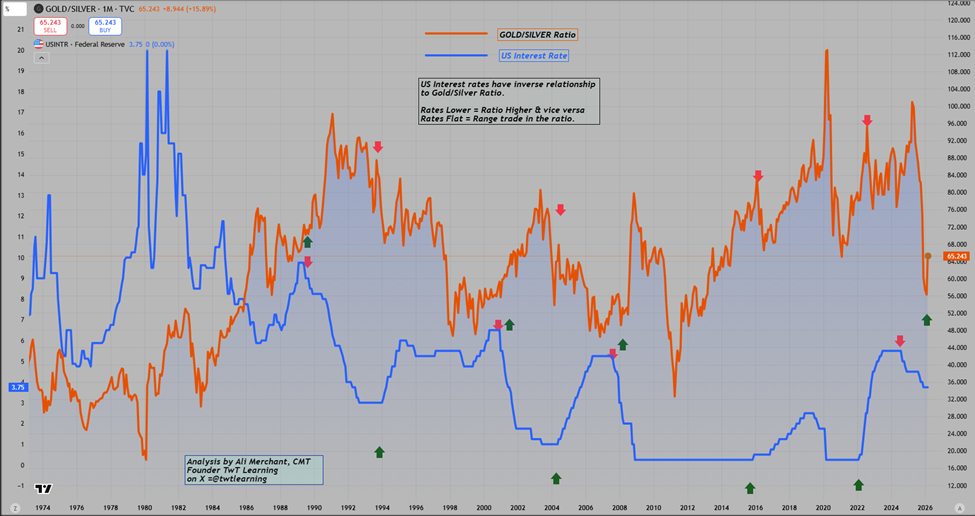
Gold/Silver Ratio vs US Interest Rate Monthly chart:
- US interest rates and the gold–silver ratio move inversely.
- Falling rates tend to push the ratio higher.
- Rising rates tend to push the ratio lower.
- Stable rates usually produce a range-bound ratio.
Gold Feb – April Price Action Seasonality:
- Since 2006, gold has typically weakened from February through April each year, except in 2011, 2024 and 2025.
- This March saw a large sell-off, suggesting further weakness in April 2026.
- We will monitor how this observation and research plays out.

Author

Ali Merchant, CMT
TwT Learning
Ali Merchant is a seasoned financial market professional with expertise in Technical Analysis, Treasury & Capital Markets, Trading, Sales, Research, Training, & Fund Management, He has been trading FX, FX options, US stocks & opti


