Gold Price Forecast: XAUUSD remains a ‘sell the bounce’ trade amid hawkish Fed bets
- Gold Price rebounds from multi-month lows but not out of the woods yet.
- Odds of a 75 bps June Fed rate hike could keep the USD, yields buoyed.
- XAU/USD massive technical breakdown suggests more pain ahead.

Hell broke loose at the start of the week on Monday after the benchmark Wall Street index, the S&P 500, confirmed a bear market. Risk-off flows intensified and a sea of red dominated across the financial markets, with the safe-haven US dollar reigning supreme. Markets pricing in of a 75 bps June Fed rate after Friday’s hot US inflation triggered fears that the aggressive tightening path could tip the economy into a recession. The US bond market sensed the growing worries, with the 2-year and 10-year Treasury yields curve inverting briefly. Investors sought refuge in the US currency in times of market panic, weighing heavily on gold price. The bright metal tested the critical $1,880 resistance on Monday before plummeting to the lowest level in four months at $1,819, where it finished the day. XAUUSD lost as much as $70, in the face of the broader market bloodbath.
Gold Price is looking to find its feet after the previous meltdown, although sellers continue to lurk amid persistent recession fears, as a 75 bps June Fed rate hike seems to be a done deal. Reuters reported that the US rate futures imply a 96% chance of the Fed raising rates by 75bps at the June meeting. This comes as Goldman Sachs revised Its Fed forecast to include 75 bps hikes in June and July.
Despite a minor recovery in risk sentiment and a pullback in the dollar from almost 20-year highs, the hawkish Fed expectations will likely keep any rebound in the yellow metal limited. The returns on the market could regain its upside traction on the hotter-than-expected US Producer Price Index (PPI), fuelling a fresh sell-off in gold price. The sentiment on Wall Street, however, could also drive the gold price action.
Gold Price Chart: Daily chart
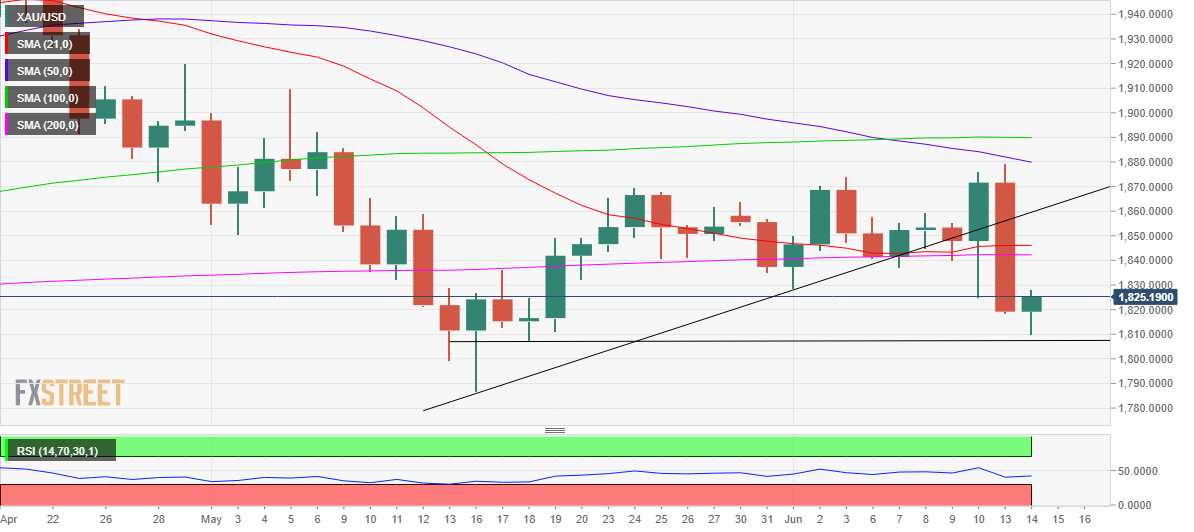
The daily chart shows that the gold price witnessed sharp selling after facing rejection at the critical downward-sloping 50-Daily Moving Average (DMA) at $1,880.
Gold dumping saw the price yields a massive breakdown below the confluence zone of the horizontal 21 and 200 DMAs between $1,846-$1,842.
The sell-off extended this Tuesday before staging a minor recovery from the $1,810 demand area.
On the upside, the previous week’s low at $1,829 will need to be scaled to kick in any meaningful turnaround.
The next critical resistance is pegged near the June 7 low of $1,837, above which the 200 DMA will be retested.
The 14-day Relative Strength Index (RSI) is turning higher towards the midline, backing the rebound in XAUUSD.
However, if XAU sellers return then the daily lows could be taken out, at first. The horizontal trendline support at $1,807 will be the line in the sand for gold optimists, below which the $1,800 threshold could be at risk.
Author

Dhwani Mehta
FXStreet
Residing in Mumbai (India), Dhwani is a Senior Analyst and Manager of the Asian session at FXStreet. She has over 10 years of experience in analyzing and covering the global financial markets, with specialization in Forex and commodities markets.