Gold Price Forecast: XAU/USD trades around $1,950 as risk aversion intensifies

XAU/USD Current price: $1,949.82
- Upbeat Chinese data partially offset the dismal mood triggered by Middle East woes.
- Wall Street turns red and trims weekly gains as earnings reports miss estimates.
- XAU/USD soars to fresh monthly highs aims to extend its advance.
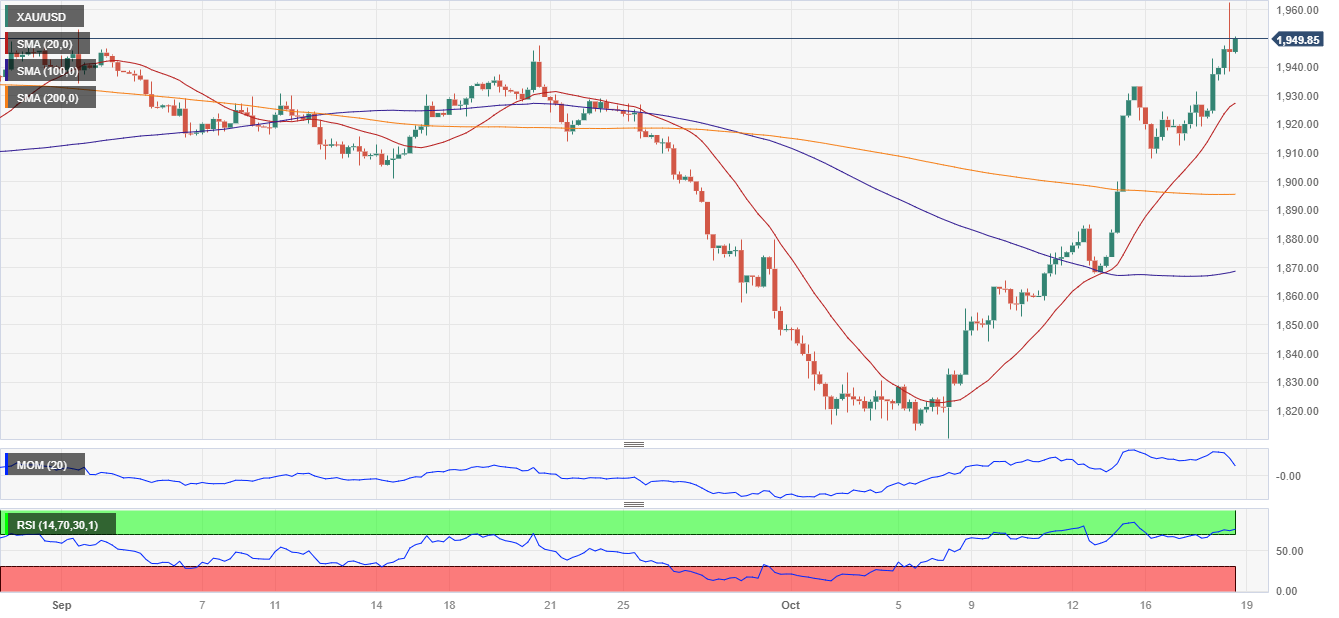
Gold price resumed its rally amid escalating Middle East tensions, reaching a fresh two-month high of $1,962.62 a troy ounce. XAU/USD holds on to intraday gains, trading at around $1,949 mid-American session as the US Dollar got some attention on the back of plummeting stock markets.
United States (US) President Joe Biden briefly visited Israel on Wednesday. Biden met Israeli Prime Minister Benjamin Netanyahu and showed the US stands alongside Israel in the conflict. The discussion revolved around the attack on a Gaza hospital that killed roughly 500 people, with President Biden stating that, according to data shown by the US Defense Department, "it appears as though it was done by the other team, not you." Earlier in the day, Palestinian officials said a failed Israeli air raid was to blame for the situation. Finally, Biden added the US will not stand by "and do nothing."
Macroeconomic data was mixed, with China reporting upbeat growth but the United Kingdom (UK) inflation surpassing market expectations. The Chinese Q3 Gross Domestic Product (GDP) was up 1.3%, improving from 0.5% in the previous quarter. Industrial Production rose at an annualized pace of 4.5% in September, while Retail Sales in the same period increased by 5.5%, beating the market expectations.
On the downside, the UK Consumer Price Index (CPI) rose at an annual pace of 6.7% in September, according to the Office for National Statistics (ONS). The figure exceeded the market expectation of 6.5% but matched the August reading.
American indexes fell following discouraging earnings reports. The Dow Jones Industrial Average is the best performer, down 0.52%. With earnings season just starting, most companies' reports surpassed analyst expectations, but Wednesday was filled with bad news.
XAU/USD short-term technical outlook
From a technical point of view, the daily chart for the XAU/USD pair hints at additional gains. The pair has soared past all its moving averages, with the 200 Simple Moving Average (SMA) being the closest and standing at around $1,930. Technical indicators, in the meantime, head firmly north, with the Momentum indicator advancing almost vertically near overbought readings. As per the Relative Strength Index (RSI) indicator, it resumed its advance and holds at a fresh multi-month high.
For the near term, the 4-hour chart suggests a corrective decline may take place, although it also shows bulls are in control of XAU/USD. A sharply bullish 20 SMA heads north far above the longer one while providing dynamic support at $1,926.50. The Momentum indicator, however, retreats after posting a lower high, yet still far above its midline. The RSI indicator turned marginally lower but remains within overbought readings.
Support levels: 1,938.20 1,926.50 1,912.35
Resistance levels: 1,962.60 1,978.90 1,987.40
Author

Valeria Bednarik
FXStreet
Valeria Bednarik was born and lives in Buenos Aires, Argentina. Her passion for math and numbers pushed her into studying economics in her younger years.