Gold Price Forecast: XAU/USD reaches lower lows ahead of the US Nonfarm Payrolls report

XAU/USD Current price: $1,817.83
- Market players remain cautious ahead of the United States monthly employment report.
- Government bond yields are now stable after peaking at multi-year highs.
- XAU/USD resumed its decline near $1,800, buyers out of the picture for now.
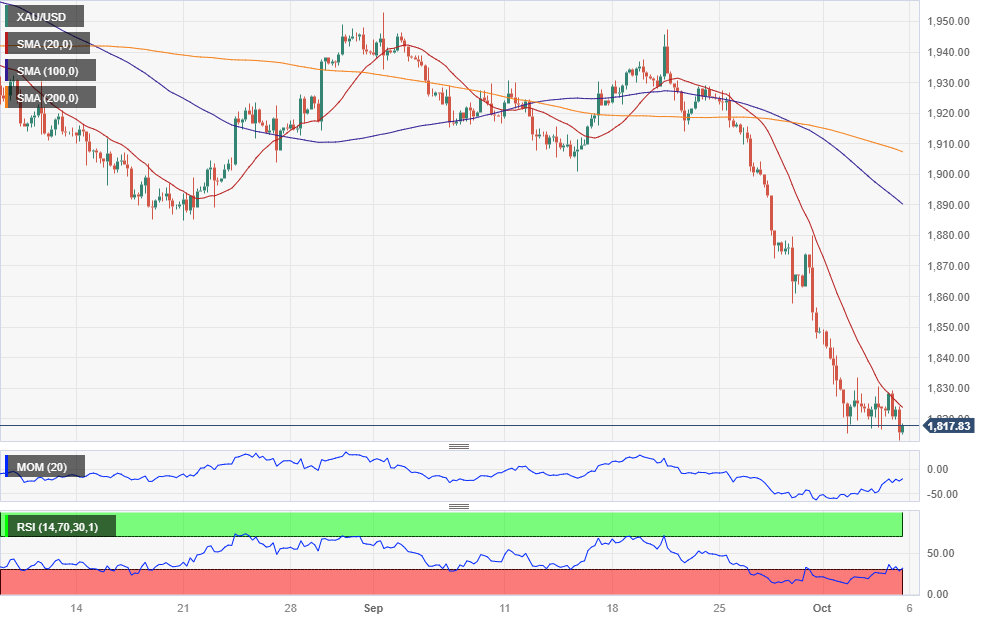
Spot Gold trades near a fresh muti-month low of $1,813 a troy ounce, with XAU/USD down for a ninth consecutive day. The bright metal is unable to attract buyers despite extreme overbought US Dollar conditions. The Greenback lost momentum on Wednesday and remained in corrective mode on Thursday, posting modest losses after reaching multi-month highs across the FX board. Still, the USD corrective decline has been uneven, mostly as investors remain cautious.
Market players are concerned persistent inflationary pressures, and a tight labor market will push the Federal Reserve (Fed) into additional monetary tightening, with the attendant risk of an economic setback. Hawkish comments from Fed officials this week, and mixed signs from the employment sector maintained the fears alive ahead of the release of the September Nonfarm Payrolls report. The country is expected to have added 178K new jobs in the month, while the Unemployment Rate is foreseen contracting to 3.7% from the current 3.8%.
Ahead of the event, US Treasury yields stabilized following rallies to record peaks. The yield on the 10-year Treasury note currently stands at 4.72%, down from a 16-year high of 4.88%, while the 2-year note offers 5.02% after soaring to 5.20% mid-September. Softer Treasury yields prevent the US Dollar from rallying in the near term.
XAU/USD short-term technical outlook
XAU/USD is bearish, according to technical readings in the daily chart. Indicators have extended their slides in extremely oversold territory without signs of downward exhaustion. The Momentum indicator accelerates south at around 94, while the Relative Strength Index (RSI) indicator stands at 18. At the same time, moving averages gain downward strength far above the current level, reflecting sellers’ dominance.
In the near term, and according to the 4-hour chart, the risk also skews to the downside. A bearish 20 Simple Moving Average (SMA) contained buyers intraday and currently acts as dynamic resistance at around $1,824.10. Meanwhile, technical indicators turned south after correcting north within negative levels, also reflecting that XAU/USD is under bears’ control.
Support levels: 1,804.70 1,792.10 1,779.85
Resistance levels: 1,824.10 1,833.35 1,845.20
Author

Valeria Bednarik
FXStreet
Valeria Bednarik was born and lives in Buenos Aires, Argentina. Her passion for math and numbers pushed her into studying economics in her younger years.

















