Gold Price Forecast: XAU/USD needs to crack $2,040-$2,050 supply zone to extend recovery
- Gold price is sitting at the highest level in six days near $2,030 early Thursday.
- Fed affirms dovish policy pivot, smashes US Dollar alongside the US Treasury bond yields.
- Gold price outlook appears constructive, as the 1D technical setup flips bullish.
- The final BoE and ECB policy announcements of 2023 could lift Gold price further.

Gold price is consolidating its latest uptick to a six-day high near $2,040, as investors reassess the bets of the US Federal Reserve (Fed) interest rate cuts next year. Gold buyers also take a breather ahead of another round of central banks’ events, with the Bank of England (BoE) and the European Central Bank (ECB) set to announce their final policy decision of 2023.
Gold price cheers dovish Federal Reserve pivot
Having treaded water in the first half of the day near three-week lows of $1,973 on Wednesday, Gold price witnessed a massive $50 turnaround in American trading. Gold price snapped its corrective mode from all-time highs of $2,144, breaking through several powerful barriers to challenge the $2,025 level.
The upsurge in Gold price was primarily driven by a dovish shift in the Federal Reserve’s monetary policy outlook for 2024. The Fed held policy rates steady between the 5.25%-5.50% target range, although its Statement of Economic Projections, the so-called Dot Plot chart, forecasted 75 basis points (bps) rate cuts next year, validating the market’s pricing of policy pivot.
Fed Chair Jerome Powell added to the dovish outlook, as he convinced markets that a rate cut will be the next policy move by the Fed, as worries over the economic outlook resurface. Powell clearly said during his post-meeting press conference that "it's not likely we will hike further. Policymakers are thinking, talking about when it will be appropriate to cut rates."
"We are very focused on not making the mistake of keeping rates too high too long,” he added. Powell’s words were enough to ramp up expectations of over 100 bps of rate cuts coming through next year, with odds of a reduction in March and May standing at 87% and 100% respectively.
Against this backdrop, the benchmark 10-year US Treasury bond yields tumbled to a four-month low of 3.971% while the US Dollar Index touched the lowest level since August at 102.56. The Fed verdict squashed expectations of the ‘Fed’s longer rates for higher’ narrative, which re-emerged following the release of the US Consumer Price Index (CPI) data on Tuesday.
The CPI edged up 0.1% last month after being unchanged in October, the Labor Department's Bureau of Labor Statistics (BLS) showed on Tuesday. Annually, the CPI increased 3.1% in November after rising 3.2% in October.
With the key event risks from the United States (US) now out of the way, attention turns toward the policy decisions from the BoE and the ECB. Markets are widely expecting policy pivots from both these central banks, as well, which could provide legs to the Gold price recovery. However, the BoE is mostly likely to push back against the rate cut expectations, which widen the policy divergence between the Fed and BoE, exacerbating the pain in the US Dollar.
In any case, Gold price remains in a win-win situation, as major global central banks return to policy normalization, as inflation concerns ease.
Gold price technical analysis: Daily chart
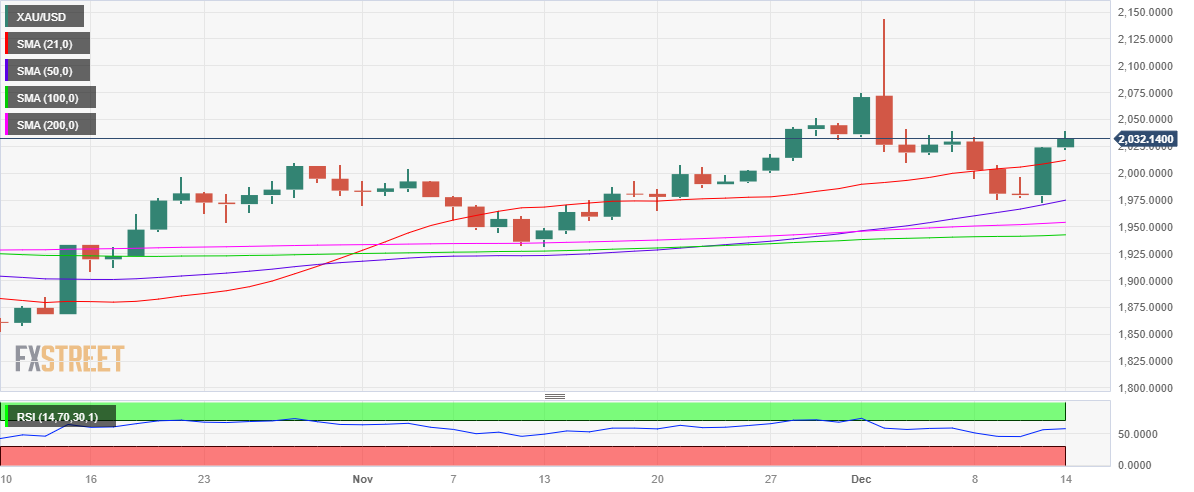
As predicted, Gold price tested the 50-day Simple Moving Average (SMA, then at $1,971 before buyers returned with a bang and took the rates back above the critical 21-day SMA aligned at $2,006 on Wednesday.
Gold price managed to settle the day above the 21-day SMA barrier, reopening the upside toward the $2,100 psychological level. However, Gold buyers will need to find a strong foothold above the $2,040-$2,050 supply zone, at first.
The 14-day Relative Strength Index (RSI) indicator is holding steady, having recaptured the 50 level. The indicator suggests that more gains remain in the offing.
Should Gold price face rejection once again near the $2050 region, a renewed selling wave could set in, with the 50-day SMA support now at $2,012 back in sight.
The next relevant cushion is seen at the flattish 200-day SMA at $1,954, below which a test of the 100-day SMA at $1,941 cannot be ruled out.
(This story is corrected on Dec 14 at 5.50 GMT to say that "Gold price is consolidating its latest uptick to a six-day high near $2,040", not $1,940.)
Gold FAQs
Why do people invest in Gold?
Gold has played a key role in human’s history as it has been widely used as a store of value and medium of exchange. Currently, apart from its shine and usage for jewelry, the precious metal is widely seen as a safe-haven asset, meaning that it is considered a good investment during turbulent times. Gold is also widely seen as a hedge against inflation and against depreciating currencies as it doesn’t rely on any specific issuer or government.
Who buys the most Gold?
Central banks are the biggest Gold holders. In their aim to support their currencies in turbulent times, central banks tend to diversify their reserves and buy Gold to improve the perceived strength of the economy and the currency. High Gold reserves can be a source of trust for a country’s solvency. Central banks added 1,136 tonnes of Gold worth around $70 billion to their reserves in 2022, according to data from the World Gold Council. This is the highest yearly purchase since records began. Central banks from emerging economies such as China, India and Turkey are quickly increasing their Gold reserves.
How is Gold correlated with other assets?
Gold has an inverse correlation with the US Dollar and US Treasuries, which are both major reserve and safe-haven assets. When the Dollar depreciates, Gold tends to rise, enabling investors and central banks to diversify their assets in turbulent times. Gold is also inversely correlated with risk assets. A rally in the stock market tends to weaken Gold price, while sell-offs in riskier markets tend to favor the precious metal.
What does the price of Gold depend on?
The price can move due to a wide range of factors. Geopolitical instability or fears of a deep recession can quickly make Gold price escalate due to its safe-haven status. As a yield-less asset, Gold tends to rise with lower interest rates, while higher cost of money usually weighs down on the yellow metal. Still, most moves depend on how the US Dollar (USD) behaves as the asset is priced in dollars (XAU/USD). A strong Dollar tends to keep the price of Gold controlled, whereas a weaker Dollar is likely to push Gold prices up.
Author

Dhwani Mehta
FXStreet
Residing in Mumbai (India), Dhwani is a Senior Analyst and Manager of the Asian session at FXStreet. She has over 10 years of experience in analyzing and covering the global financial markets, with specialization in Forex and commodities markets.

















