Gold price forecast: Market drivers to watch in 2025 at $3,500 resistance

Gold (XAU/USD) prices have recently corrected after hitting the key resistance level at $3,500. However, the pullback appears healthy and reflects underlying strength in the gold market. Traders are now closely monitoring global developments, particularly tariff-related news, that could influence gold demand. Despite the recent correction, the overall trend remains bullish.
Fed rate cut speculation and Dollar weakness support Gold prices
Despite the dip in gold prices, the metal continues to show strength and remains in an uptrend. US Treasury Secretary Scott Bessent recently downplayed expectations of a swift trade deal between the US and China. He dismissed the possibility of immediate tariff cuts, which had previously lifted market sentiment. This renewed uncertainty has brought gold back into focus as a safe-haven asset.
At the same time, expectations are rising that the Federal Reserve may soon shift back to a rate-cutting path. Lower interest rates typically weaken the US Dollar and increase gold’s appeal, as gold does not yield interest. Additionally, the recent decline in the US Dollar has supported gold prices.
Moreover, the market is showing mixed signals. There are signs of a possible trade deal and reduced concerns about the Fed’s independence. Combined with improved investor sentiment, these factors are limiting gold’s ability to post larger gains. Many bullish traders are holding back as they await fresh economic data from the US.
Ascending broadening wedge points to critical breakout zone at $3,500
The weekly chart for gold shows that the price is moving within an Ascending Broadening Wedge. This pattern started forming around 2015 and continues through to 2025. The wedge is characterized by higher highs and higher lows, widening over time.
Historically, this pattern signals a potential reversal after a bullish run. Gold has now reached the upper resistance line of the wedge. A red arrow on the chart highlights where the price touched and slightly breached this upper boundary.
Following this touch, a slight retreat is visible. The retreat suggests the market is reacting to the resistance zone. The orange circle marks this turning point, indicating a possible shift in sentiment or pause in bullish momentum.
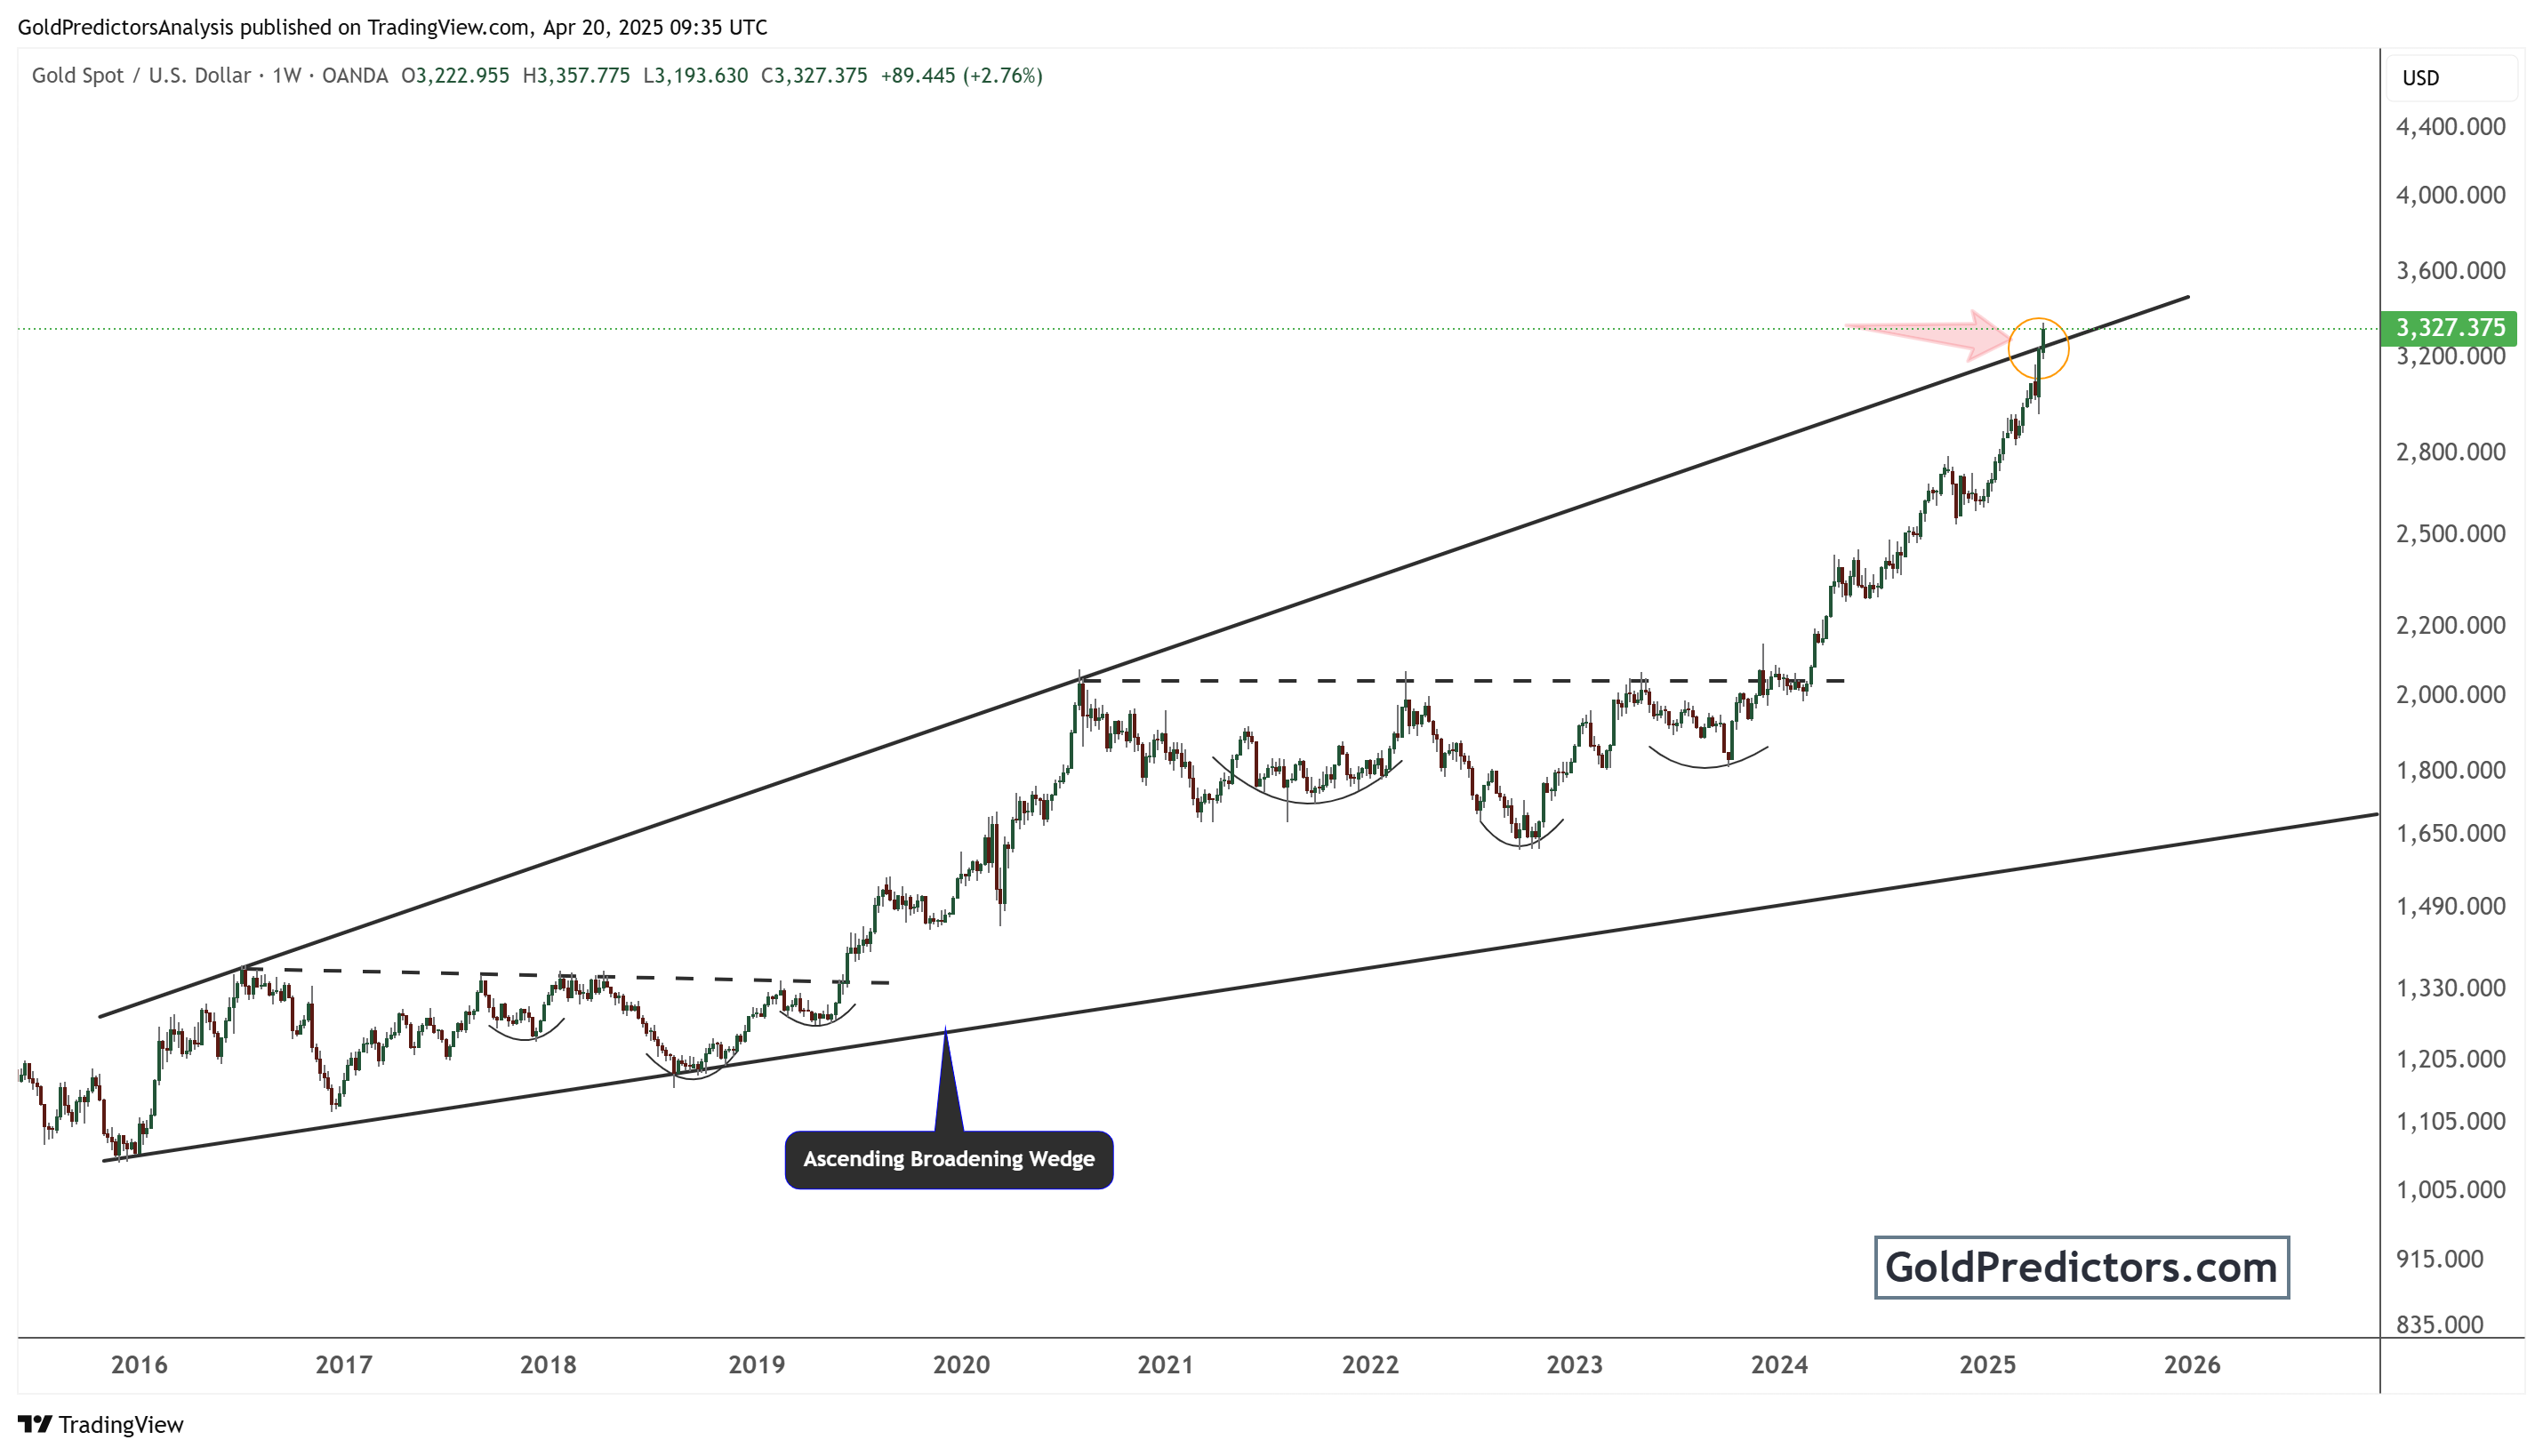
Multiple inverted head and shoulder formations also appear throughout the chart. These are bullish continuation patterns. They supported the steady rise in gold prices from 2018 through 2024.
However, prices now sit in a critical zone. If gold fails to break above the upper wedge boundary with strong momentum, a downside correction may follow. On the other hand, a clean breakout above this line with volume confirmation could signal the next bullish leg.
The support trend line at the bottom of the wedge provides the long-term safety net. As long as prices stay within the wedge, the trend remains upward — but the risk of correction increases at the top boundary.
Conclusion
Gold prices continue to trade near record highs despite recent pullbacks. Political uncertainty, possible Fed rate cuts, and USD weakness keep the metal in demand. However, the technical chart reveals a critical moment. Gold is at the top edge of a broadening wedge, where bulls often hesitate. If a breakout occurs, it may spark further gains. On the other hand, a pullback might offer a better entry for long-term buyers. Traders should watch upcoming US data and geopolitical developments closely to guide their next move.
Unlock exclusive gold and silver trading signals and updates that most investors don’t see. Join our free newsletter now!
Unlock exclusive gold and silver trading signals and updates that most investors don’t see. Join our free newsletter now!
Author


