Gold price falls as Middle East tensions boost US Dollar demand

Gold (XAU/USD) prices are pulling back after facing renewed pressure from a stronger US Dollar. Rising geopolitical uncertainty in the Middle East supported the Dollar and limited gold's recent recovery. Meanwhile, weaker US labor market data continued to shape expectations for Federal Reserve policy. Investors now watch upcoming economic data and key technical support levels for clues about gold's next move.
Gold price retreats as Dollar rebounds on Middle East uncertainty
Gold has lost some upward momentum as improving demand for the US Dollar limits further gains. The recovery in the dollar followed renewed uncertainty surrounding the Middle East. Iran announced plans to introduce new service fees for vessels passing through the Strait of Hormuz. At the same time, Iranian officials stated that discussions with the United States would not move forward until all conditions of the existing memorandum are fulfilled. These developments increased uncertainty across financial markets and supported demand for the US Dollar.
The Japanese Yen also remained under pressure, allowing the USD/JPY pair to move higher. This additional support helped the US Dollar recover from its recent weakness. A stronger dollar often limits the appeal of gold because it makes the metal more expensive for buyers using other currencies. As a result, gold struggled to extend its recent rebound despite ongoing geopolitical uncertainty.
At the same time, weaker US labor market data continued to influence expectations for Federal Reserve policy. The US economy added only 57,000 jobs in June, well below the forecast of 110,000. The Labor Force Participation Rate also declined to 61.5%, marking its lowest reading in more than five years. These figures reduced expectations for another interest rate hike in September. The market now turns its attention to upcoming economic data and Federal Reserve signals for the next move in gold.
Gold price trades within symmetrical triangle as resistance limits recovery
The gold chart below shows that price is trading within a large symmetrical triangle. Price remains below the descending resistance trendline while continuing to hold above the rising support trendline. This structure reflects a period of consolidation as the trading range gradually narrows, making the triangle boundaries important levels to watch.
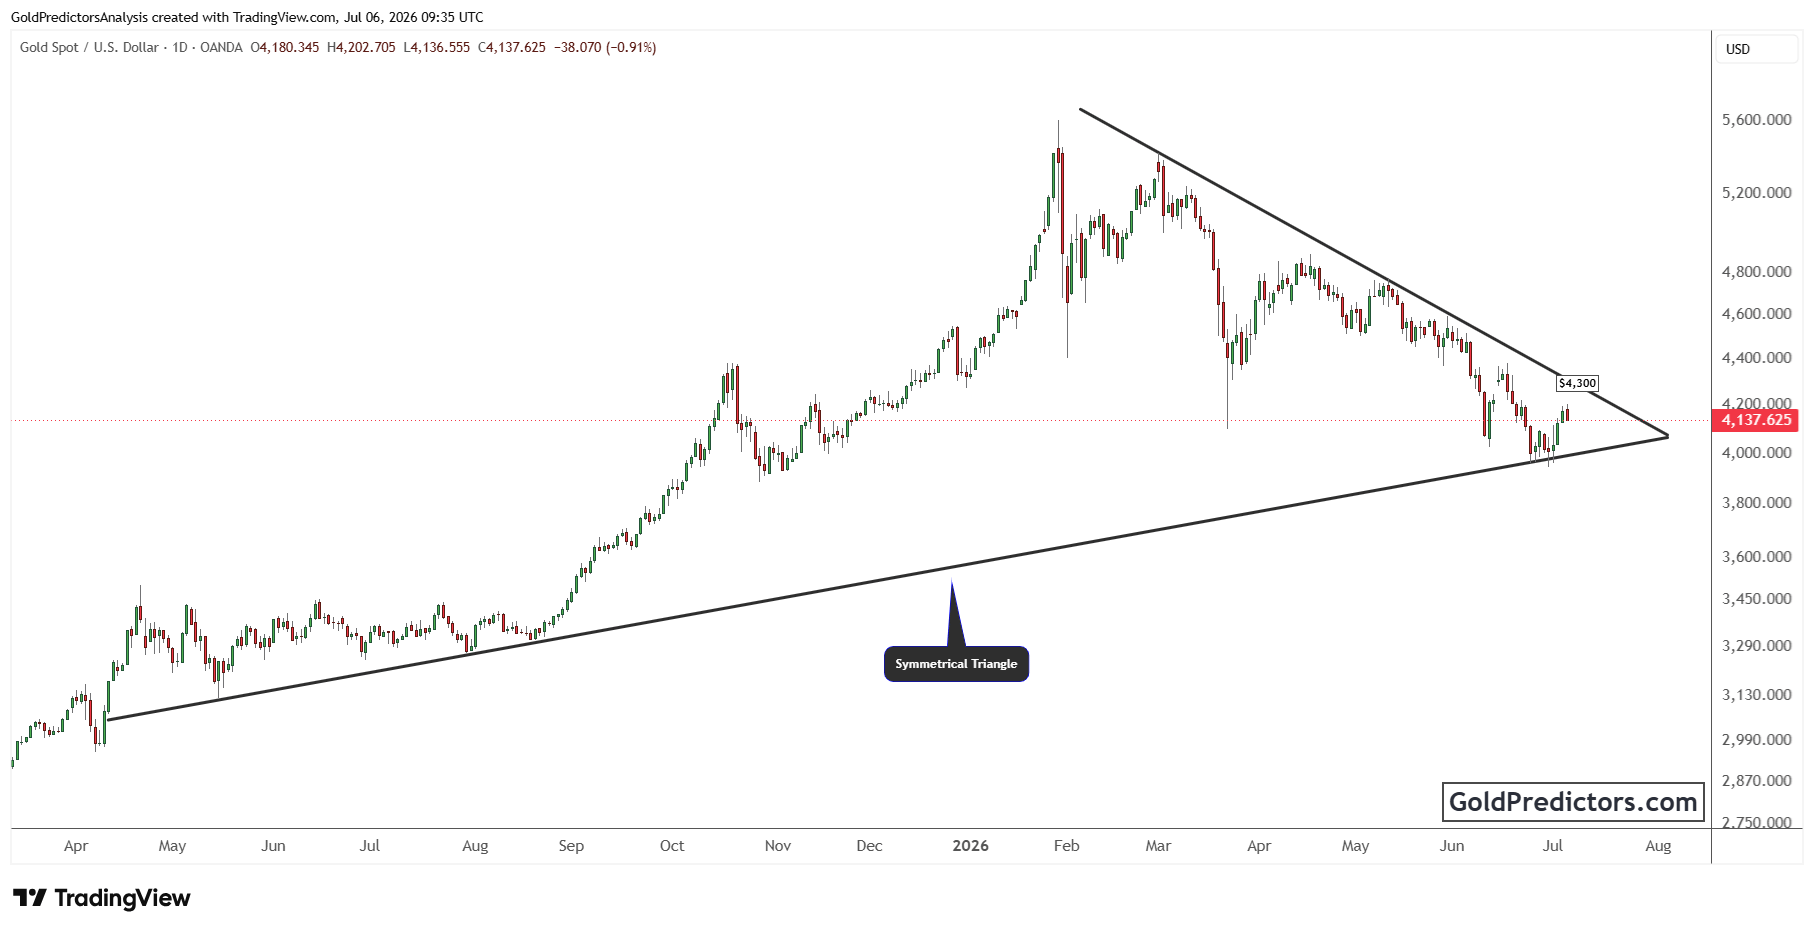
Gold recently moved higher after finding support near the lower boundary of the triangle. The recovery has brought price back toward the descending resistance trendline, where upside momentum is facing renewed pressure. This trendline remains the main barrier for the current advance. Price is now pulling back from this resistance, keeping attention on the triangle support.
The rising support trendline remains an important level to watch. Holding above this support would keep the long-term structure intact. The current decline is shifting attention toward the rising trendline, where price action could provide clues about the next medium-term direction.
Gold price outlook: Stronger US Dollar and Middle East tensions drive sentiment
Gold prices remain under pressure as renewed demand for the US Dollar limits further gains. Investors will closely watch upcoming economic data and Federal Reserve signals for fresh direction. From a technical perspective, the rising support trendline remains the key level to watch as price pulls back from triangle resistance. The next move will likely depend on whether gold holds above this support or extends its current decline.
Unlock exclusive gold and silver trading signals and updates that most investors don’t see. Join our free newsletter now!
Author

Muhammad Umair, PhD
Gold Predictors
Muhammad Umair is a financial markets analyst and investor who focuses on the forex and precious metals markets.
















