Gold just breached 200-day moving average: Why the US CPI report is key

Gold just flashed a major sell signal on a breach of the critical 200-day SMA. While bears should remain cautious, the upcoming US CPI report could still reverse the outlook, deciding whether Gold rebounds to $4,450 or dives into deeper lows.
After the dive seen on Friday due to the US Nonfarm Payrolls blockbuster data, Gold is consolidating the bearish trend. Falling below the 200-day SMA was a crucial breakdown of a support that had provided a floor for prices several times in the past three months. Now, only a sustained recovery above this level could negate the bearish outlook.
Fed rate hike bets are mounting, and that’s not good for Gold
Fundamentals have shaped up significantly in the lead-up to the US CPI showdown. Gold is now clearly seen as a “sell-the-rallies” trade, and the upcoming US CPI data is eagerly awaited for fresh hints on whether the US Fed would opt for an interest rate hike later this year.
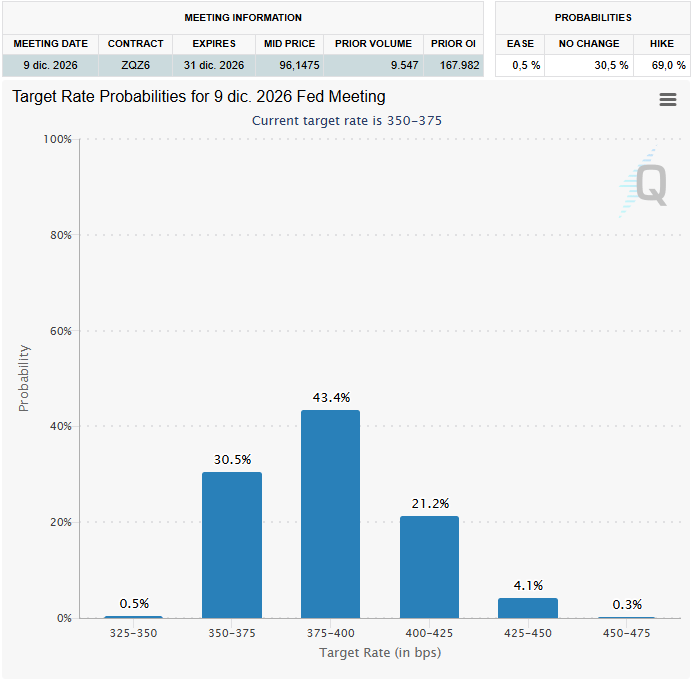
The May Nonfarm Payrolls outpaced expectations for a third month in a row, bolstering bets for a Fed rate hike by December. Markets now predict a roughly 70% chance of at least one rate hike before the end of the year, according to the CME Group’s FedWatch Tool.
Fed policymakers, in their recent speeches, have also raised concerns about inflation due to the continued Oil price surge, while calling for higher rates. So, this CPI report will be at the forefront of the FOMC officials’ minds.
Remember that Gold tends to thrive in a low-interest-rate regime. Therefore, Gold needs a softer-than-expected inflation print to alter these rate hike projections and reverse the bearish trend. The real question now is: will US CPI confirm Fed rate hike bets or push back against these expectations?
What do markets expect?
The annual core CPI inflation in the US is seen ticking higher to 2.9% in May. The monthly core CPI is expected to rise by 0.3% in May after a 0.4% increase in April. These core measures, which exclude the volatile food and energy categories, are shielded from the war’s impact on energy prices and present a real picture for the Fed.
Economic Indicator
Consumer Price Index ex Food & Energy (YoY)
Inflationary or deflationary tendencies are measured by periodically summing the prices of a basket of representative goods and services and presenting the data as the Consumer Price Index (CPI). CPI data is compiled on a monthly basis and released by the US Department of Labor Statistics. The YoY reading compares the prices of goods in the reference month to the same month a year earlier. The CPI Ex Food & Energy excludes the so-called more volatile food and energy components to give a more accurate measurement of price pressures. Generally speaking, a high reading is bullish for the US Dollar (USD), while a low reading is seen as bearish.
Read more.Next release: Wed Jun 10, 2026 12:30
Frequency: Monthly
Consensus: 2.9%
Previous: 2.8%
Source: US Bureau of Labor Statistics
The US Federal Reserve has a dual mandate of maintaining price stability and maximum employment. According to such mandate, inflation should be at around 2% YoY and has become the weakest pillar of the central bank’s directive ever since the world suffered a pandemic, which extends to these days. Price pressures keep rising amid supply-chain issues and bottlenecks, with the Consumer Price Index (CPI) hanging at multi-decade highs. The Fed has already taken measures to tame inflation and is expected to maintain an aggressive stance in the foreseeable future.
Key CPI scenarios for Gold prices
Gold is primed for intense volatility even if the inflation slows or comes in hotter. There are two main scenarios to focus on in the CPI release:
- Hotter-than-expected inflation: If the annual and monthly core CPI inflation picks up at a quicker pace than expected, that would reaffirm the Fed rate hike bets. This scenario will exacerbate Gold’s melting trend, dragging the metal back to three-month lows near $4,270, below which the $4,200 round level will be tested.
- Below-forecast inflation: Below-forecast US inflation data could scale back Fed rate-hike bets. In this case, the non-yielding bullion could rebound firmly to re-test the 200-day SMA at around $4,450. A break higher is more of a long shot, but could target the 21-day SMA near $4,510.
If inflation aligns with expectations, Gold could see minimal reaction but risks volatility amid incoming Middle East headlines.
(This article was created with the help of an Artificial Intelligence tool and reviewed by an editor.)
Author

Dhwani Mehta
FXStreet
Residing in Mumbai (India), Dhwani is a Senior Analyst and Manager of the Asian session at FXStreet. She has over 10 years of experience in analyzing and covering the global financial markets, with specialization in Forex and commodities markets.


