Gold hits key resistance barrier and pulls back
- Gold hits 4,640 and pulls back on new Hormuz tensions.
- A break below 4,510 could invite more bears and aim for 4,345.
- Both the RSI and the MACD are detecting bearish momentum.
- Rebound above 4,840 is needed for outlook to start looking bullish.

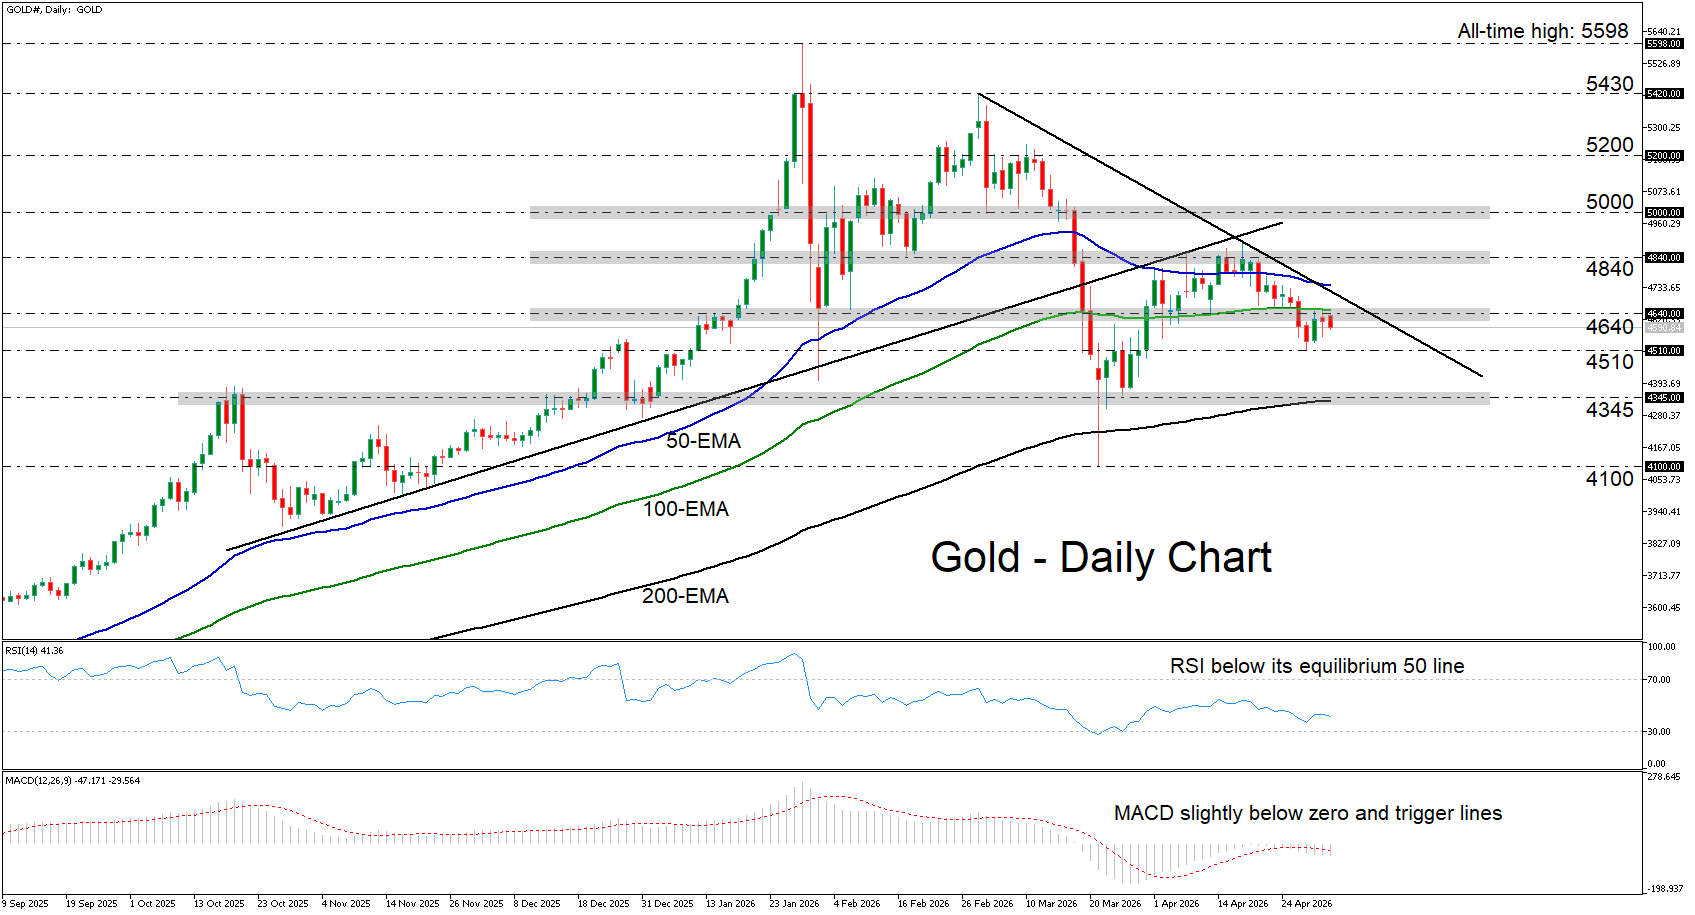
Gold rebounded last week after hitting a low of 4,510 due to the hawkish Fed decision. That said, the recovery remained limited and short-lived. The metal hit resistance at the key barrier of 4,640 and pulled back as investors remained convinced that the Fed might implement rate hikes next year, alongside reports of a tanker being struck by unknown projectiles in the Strait of Hormuz.
The precious metal is trading well below the prior uptrend line drawn from the low of November 18. It is now following a new short-term downtrend line taken from the high of March 2. It is also trading below the 50- and 100-day exponential moving averages (EMAs), with the latter offering an extra layer of resistance near the 4,640 zone. All this increases the chances of gold drifting further south.
If the bears manage to overcome last week’s low of 4,510, they could aim for the next key support at 4,345, which coincides with the 200-day exponential moving average (EMA). If they are not willing to stop there either, further declines could set the stage for the low of March 23 at 4,100.
The momentum indicators are detecting bearish momentum, corroborating the notion that further declines may be looming. The RSI is below 50 and pointing down, while the MACD is running slightly below both its zero and trigger lines, also pointing south.
On the upside, a strong rebound above 4,840 and then above the key psychological zone of 5,000 could signal a shift toward a more bullish outlook. The former move would take the price above the short-term downtrend line, while the latter would take it back above the prior uptrend line. A break above 5,000 could see scope for extensions towards the 5,200 area.
To recap, gold pulled back after hitting the key resistance of 4,640, with a move below 4,510 likely to be the trigger for more declines.
Author

Charalampos joined Trading Point in August 2022 as a senior market analyst. He has extensive experience in analyzing financial markets, gained through a decade-long career, with his primary focus being on the currency market.
















