Gold has priced a Fed pause. The hike is still coming

July inflation landed exactly where the consensus had it, on all four lines of the release, and Gold responded by adding around 1% and holding fast near $4,400/ounce, trading at its highest since early June. A print that surprises nobody is not supposed to move a metal that far. This one did, because the composition underneath the headline handed a hawkish Federal Reserve (Fed) the cover to wait, and the rate market cut the odds of a September hike from a coin flip to a 38% tail inside the hour.
What the same curve says about October and December is the problem. The hike did not come off the calendar. It moved by one meeting, and Gold has repriced as though it were cancelled.
The print a hawkish Fed can look through
The Consumer Price Index (CPI) rose 0.1% in July against a 0.1% consensus, after falling 0.4% in June, and 3.4% over the year against 3.4% expected, down from 3.5%. Core, stripping food and energy, rose 0.2% against 0.2% expected and 2.5% over the year against the same, down from 2.6% and the softest core reading since January. Four lines, four bullseyes.
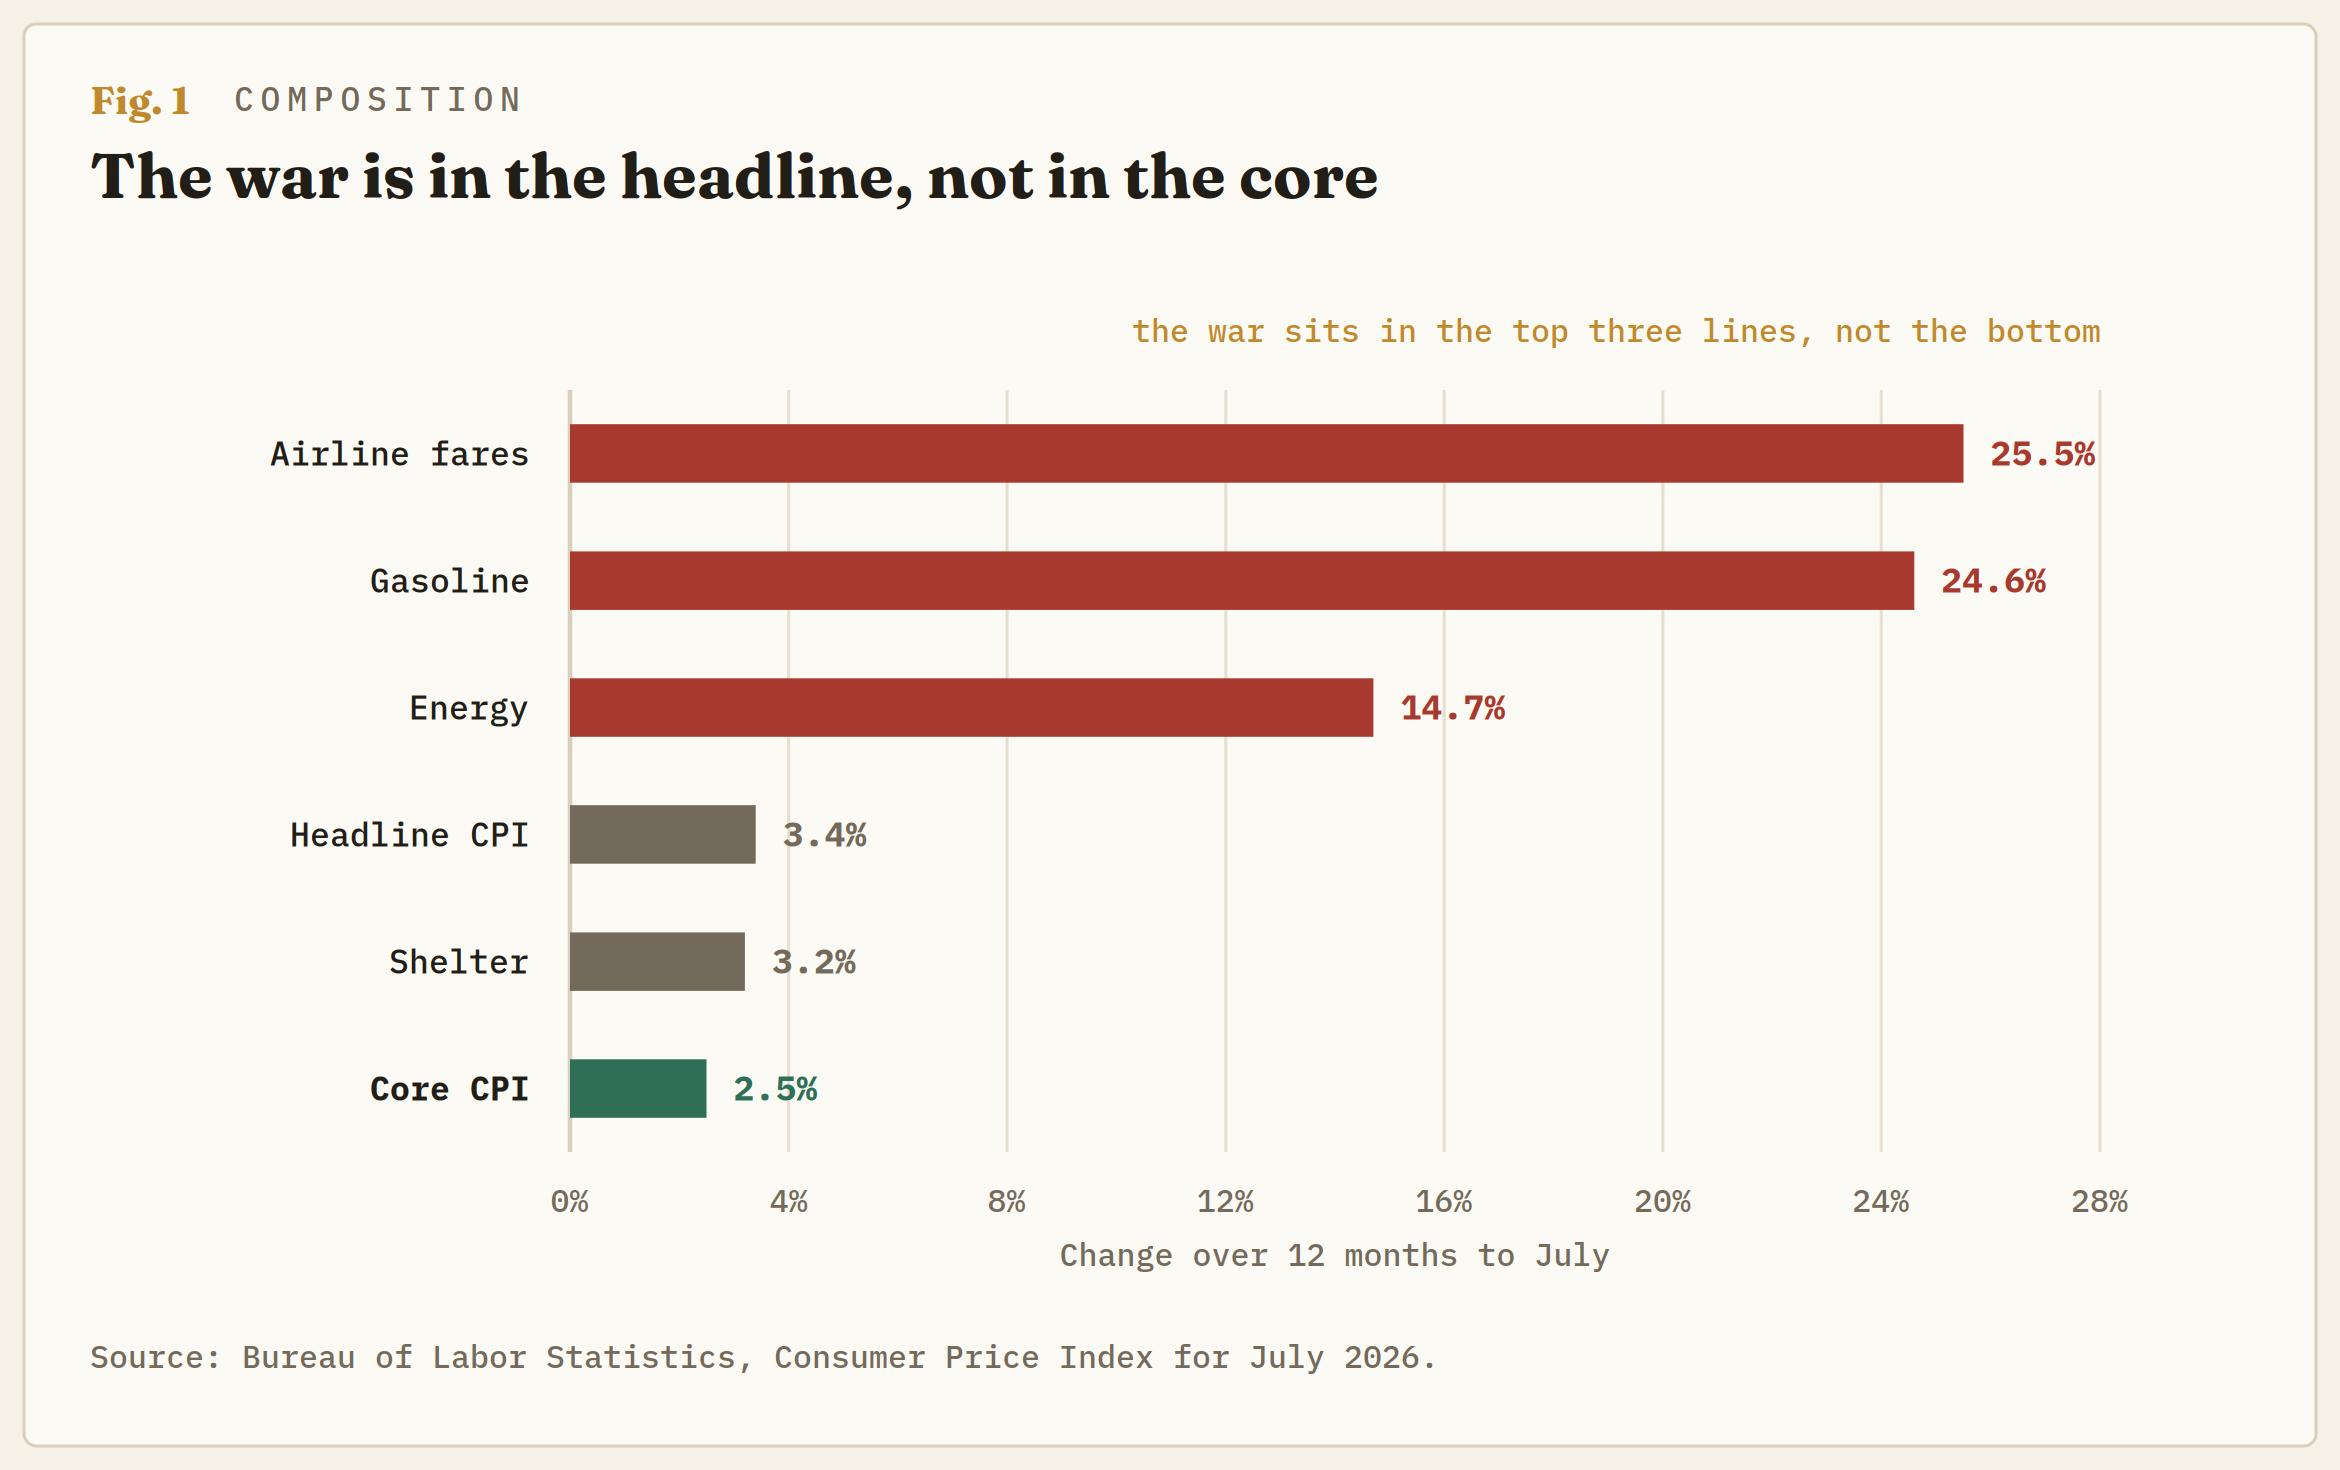
The interesting part sits in the detail tables. Shelter rose 0.1% on the month and accounted for roughly two-thirds of the entire all-items increase, which is a very quiet way to build a headline. Energy fell 1.5% on the month with gasoline down 2.9%. Yet energy is still 14.7% higher over the year and gasoline 24.6% higher, and airline fares, the cleanest passthrough from jet fuel to the consumer basket, rose 2.2% on the month and 25.5% over the year.
Read those together and the war is sitting almost entirely in the headline index while the core keeps grinding lower. That is the single most convenient shape a conflict-driven inflation impulse can take for a central bank that does not want to tighten into a supply shock. It lets policy treat the barrel as relative prices rather than inflation, look through the energy line, and point at a 2.5% core as evidence that the underlying trend is intact.
Gold understood that immediately and correctly. The metal opened near $4,371, dipped to $4,362 ahead of the release, then ran to $4,441 after it and holds around $4,434. Buying a soft core print is the right trade on the day.
The hike moved by one meeting, not off the calendar
Here is where the tape and the curve part company.
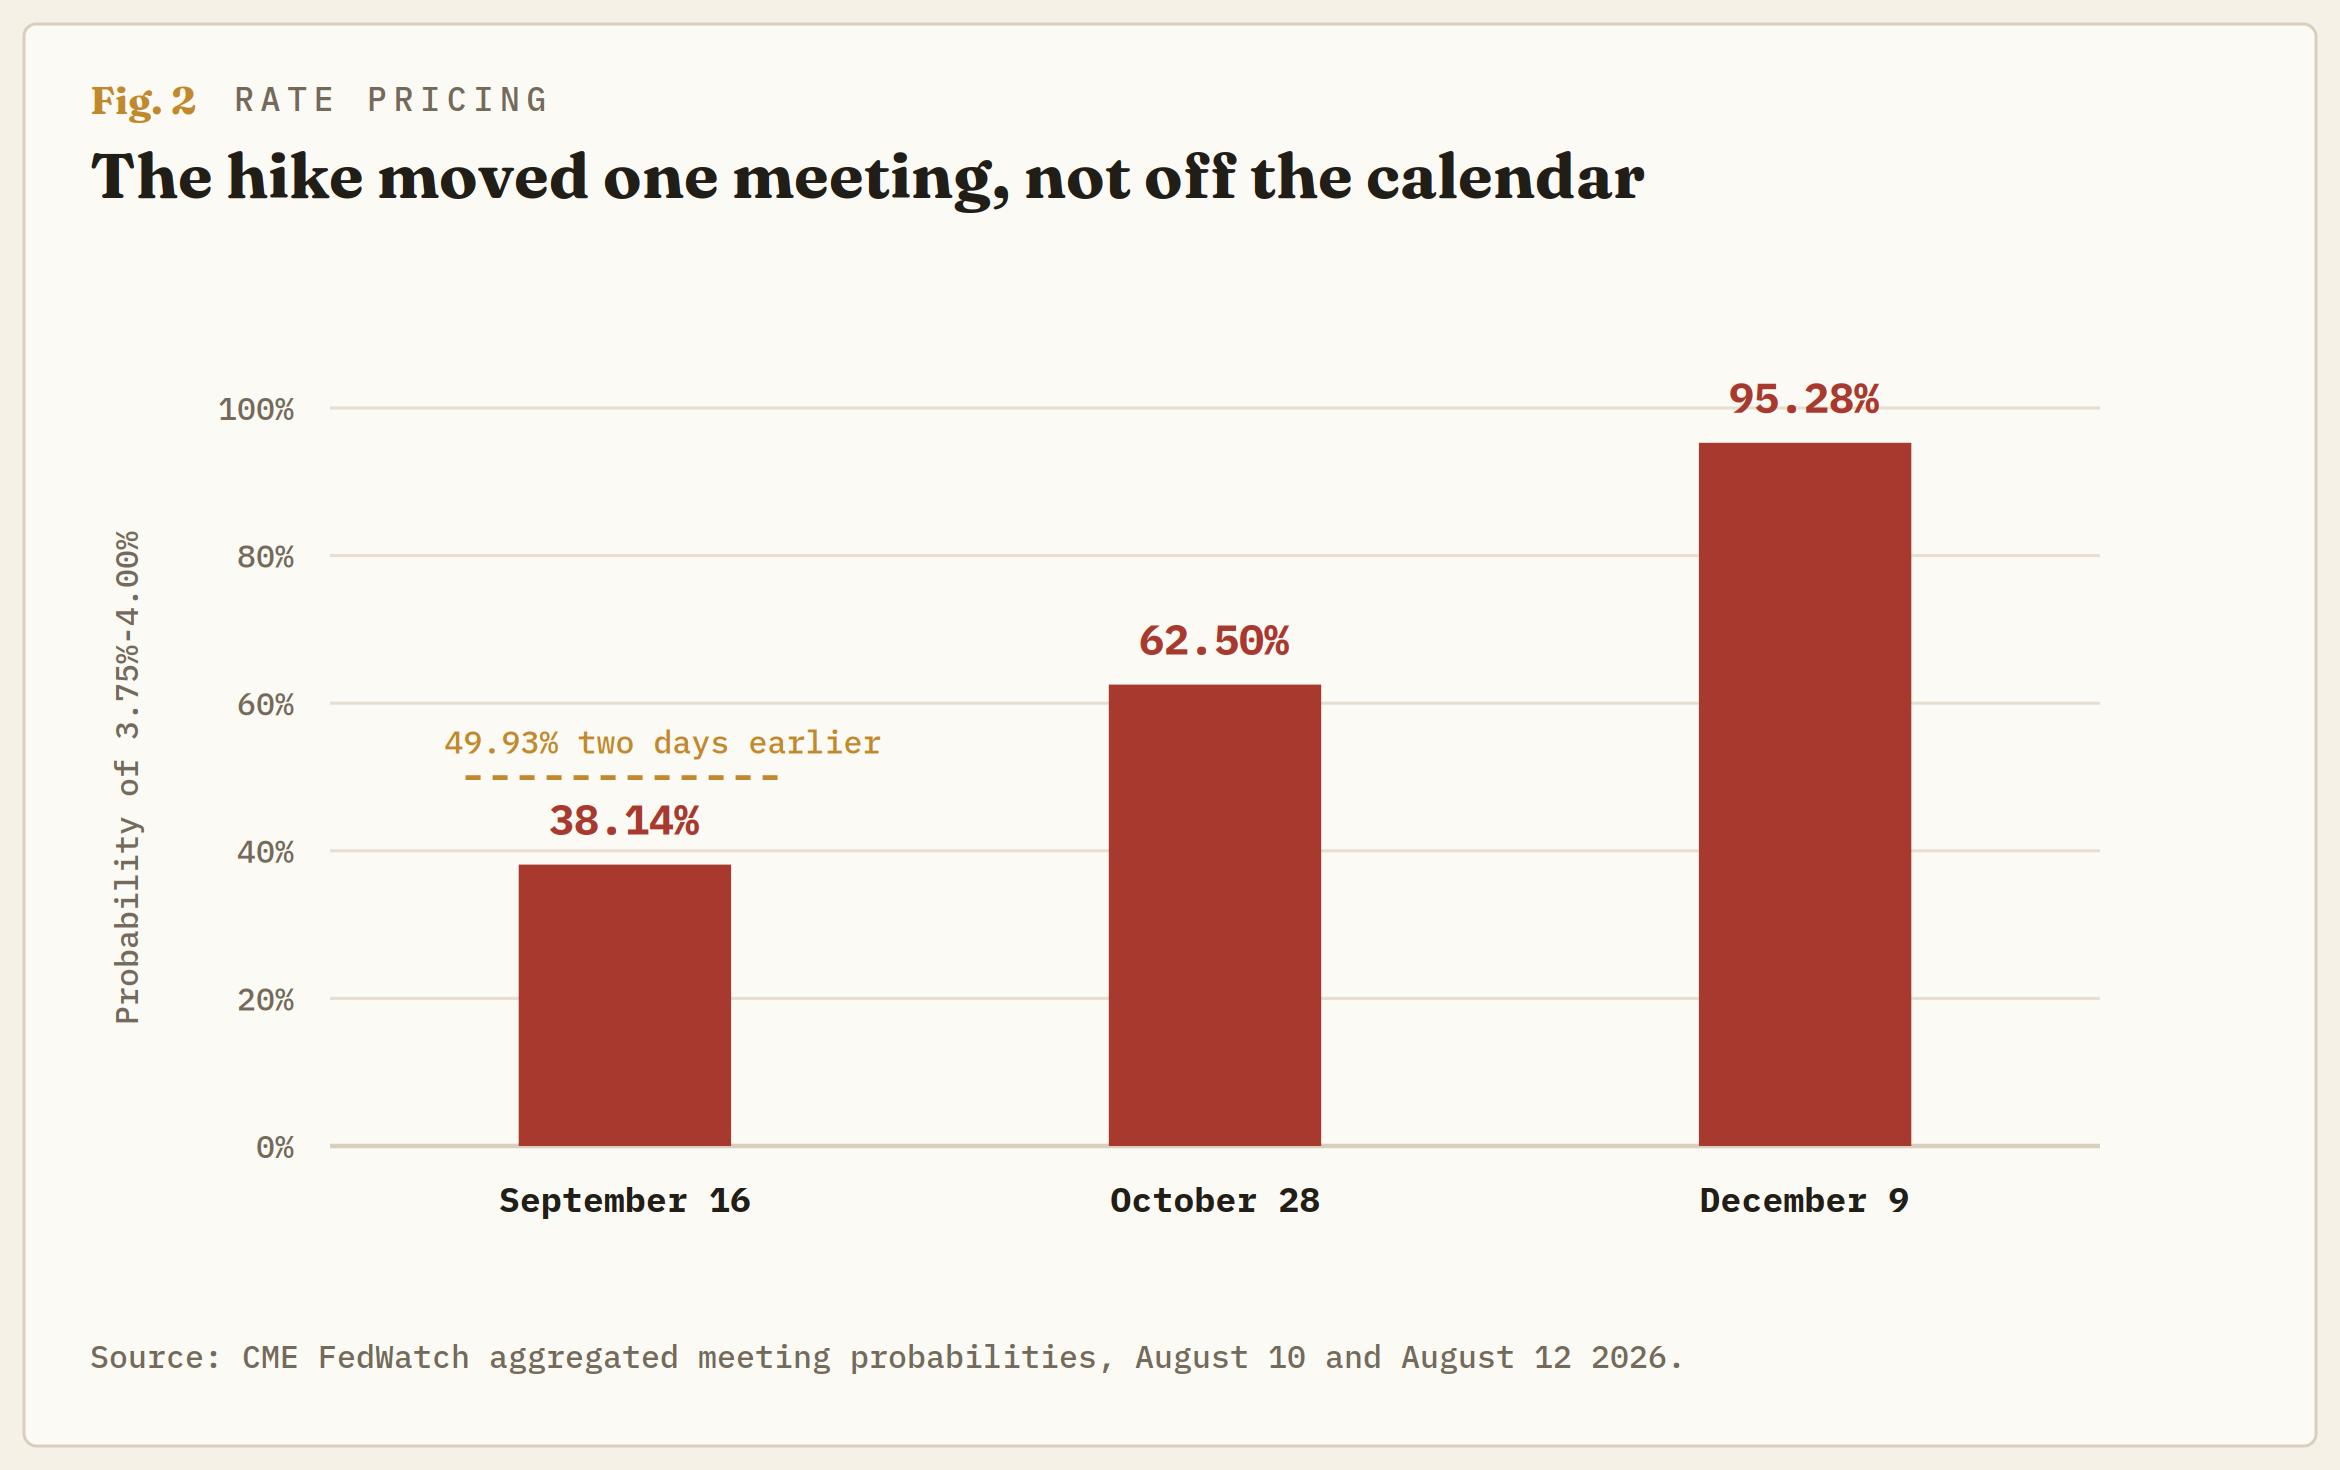
The September 16 meeting now prices at 61.86% for a hold in the current 3.50%-3.75% band against 38.14% for a quarter-point move. Two days ago, that same meeting was a coin flip. So far, so consistent with a metal rallying.
Run the curve forward and the picture inverts. The October 28 meeting carries 62.50% for the 3.75%-4.00% band, meaning the market is already better than three-in-five that the hike has happened by Halloween. By December 9, that band carries 95.28%, with a further 4.72% sitting above it. On the conditional distribution, the December tail is fatter still, 23.9% for two hikes and 3.9% for three.
That is not a market that has abandoned tightening. It is a market that has slid one hike five weeks to the right and left the destination almost exactly where it was. The terminal expectation is barely disturbed. What changed is the timing, and only the timing.
For a non-yielding asset, the distinction is close to everything. Gold funds itself against real rates, and a hike deferred by one meeting costs a holder roughly five weeks of carry differential. Five weeks of carry is worth a few dollars an ounce, not a hundred and fifty. The metal has taken a timing adjustment and priced it as a change of regime.
The chart has run ahead of the repricing
The mechanical picture makes the same case without needing a single rate probability.
Gold spent the summer beneath its 200-day exponential moving average and reclaimed it only in the past few sessions. That average sits near $4,290. The 50-day sits near $4,220, roughly $70 below the 200-day, which means the shorter average still trades under the longer one and the alignment that produced the June and July decline has not reversed. It has simply been jumped.
Price now trades about 3.4% above the 200-day and better than 5% above the 50-day, having travelled almost 12.7% from the July low near $3,941 in about three weeks. Daily Stoch RSI is above 81 and pressed into the overbought band. A market that reclaims a long moving average usually does it, backs and fills, and lets the shorter average catch up. This one has gone straight through and kept going.
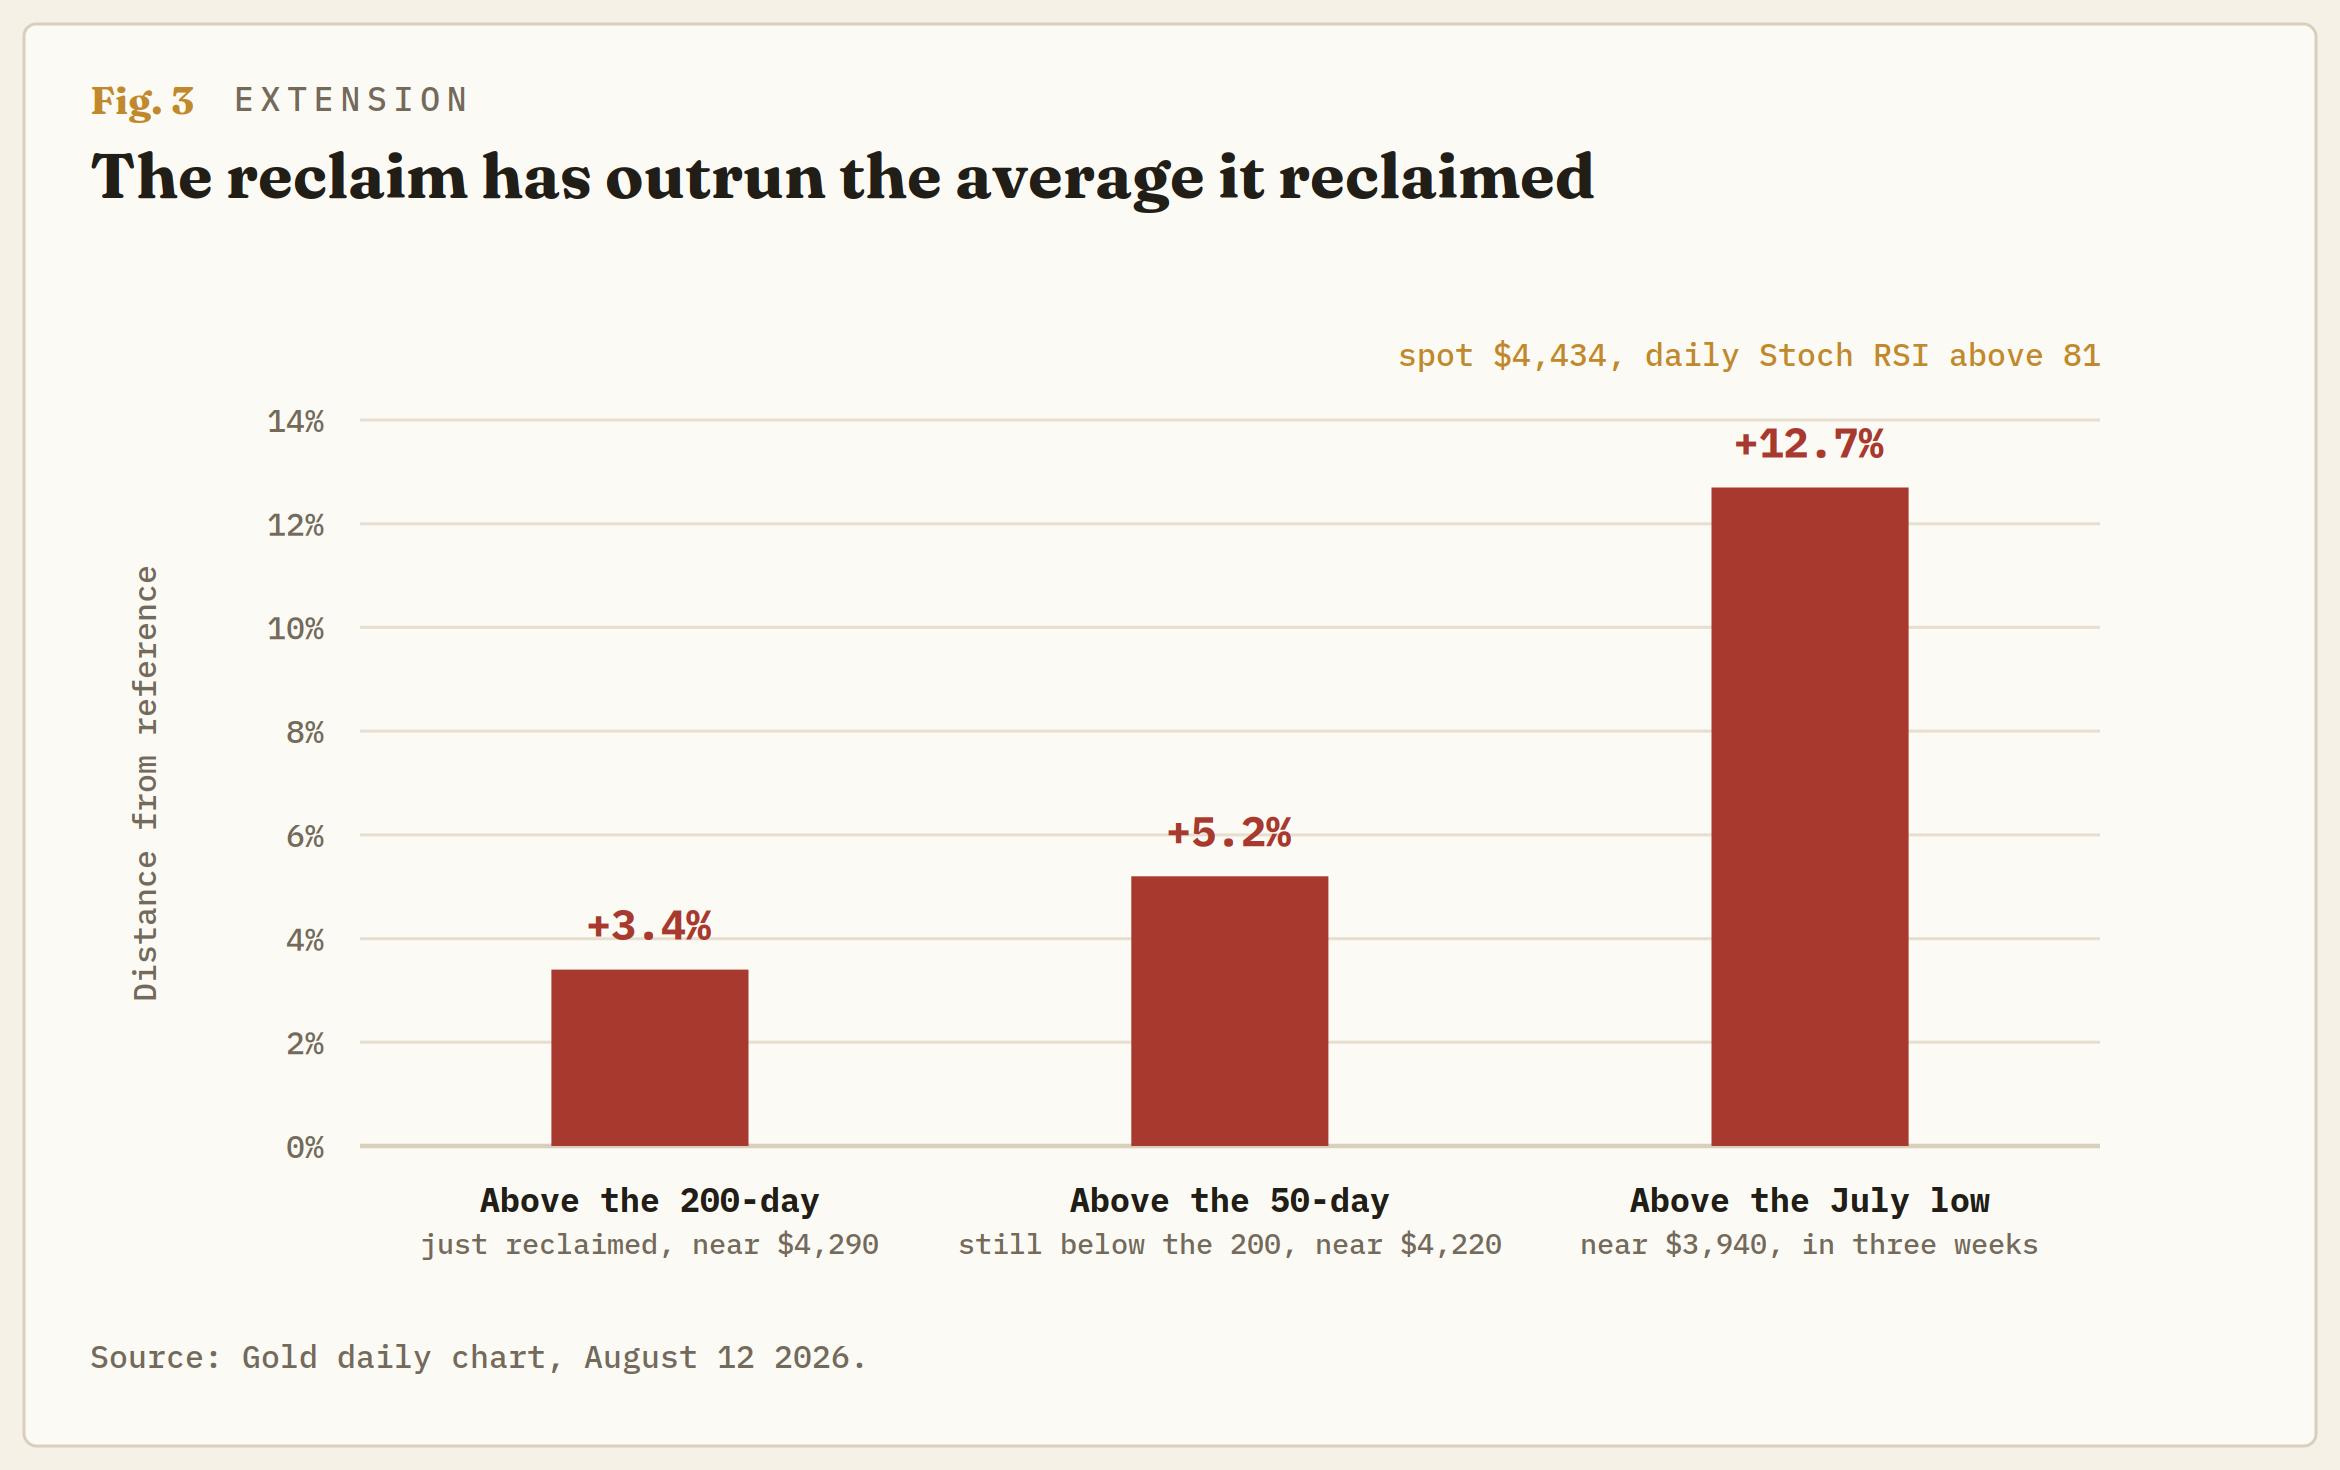
None of that makes the direction wrong. Moving averages do not cap anything, and a genuine regime change ignores them for months at a time. It does mean the move has borrowed heavily from the future, on a rate repricing that turns out to be a deferral, at a momentum reading that historically precedes consolidation rather than acceleration.
Two dates decide it
The near-term test arrives quickly, and both legs of it land inside 48 hours.
Producer prices come Thursday, with the headline expected at 0.2% on the month and 4.9% over the year against 5.5%, and the core measure at 0.3% and 4.2% against 4.7%. A soft PPI corroborates the CPI, pushes the September odds lower still, and gives the current Gold level a fundamental leg it presently lacks. A firm one, particularly in the core, tells the market the July CPI was an energy artefact and pulls September back toward the coin flip it was on Monday. Two Fed speakers follow the print within half an hour, one of them among the three who dissented for a quarter point at the July meeting, which is the first chance anyone on the committee has to react to the disinflation in public.
Friday brings retail sales and the preliminary Michigan survey, where the one-year inflation expectation sits at 4.2% and the five-year at 3.3%. Consumer expectations running that far above target are the strongest argument the hawks have, and a further rise there would be the most direct threat to the September pause the market has just bought.
The framework from here
The bias is for consolidation rather than continuation, and the levels are unusually clean.
$4,400 is the pivot in play, and holding it on a daily basis keeps the reclaim credible. Losing it turns attention to $4,300, which is effectively the 200-day and the line that decides whether the past three weeks were a regime change or an overshoot. Beneath that, $4,200 sits on the 50-day and is where the overbid thesis would be fully expressed. The July floor near $4,000 is the deeper reference and is not in play absent a hawkish PPI surprise.
To the upside, $4,500 is the level that matters, because it is where the June breakdown began and where trapped supply from that decline is likeliest to sit. A daily close above $4,500 invalidates the overbid reading outright and says the market is pricing something larger than a five-week deferral, most plausibly a view that the tightening cycle is over rather than paused.
Position for the gap between timing and destination. The tape has priced a September pause. The curve has priced an October or December hike at better than 95% by year-end. Both cannot be worth $4,434, and the reconciliation runs through Thursday's producer prices.
Author

Joshua Gibson
FXStreet
Joshua joins the FXStreet team as an Economics and Finance double major from Vancouver Island University with twelve years' experience as an independent trader focusing on technical analysis.
















