|

GBP/USD: Trading with the wave count and banking +88 Pips (+4%)

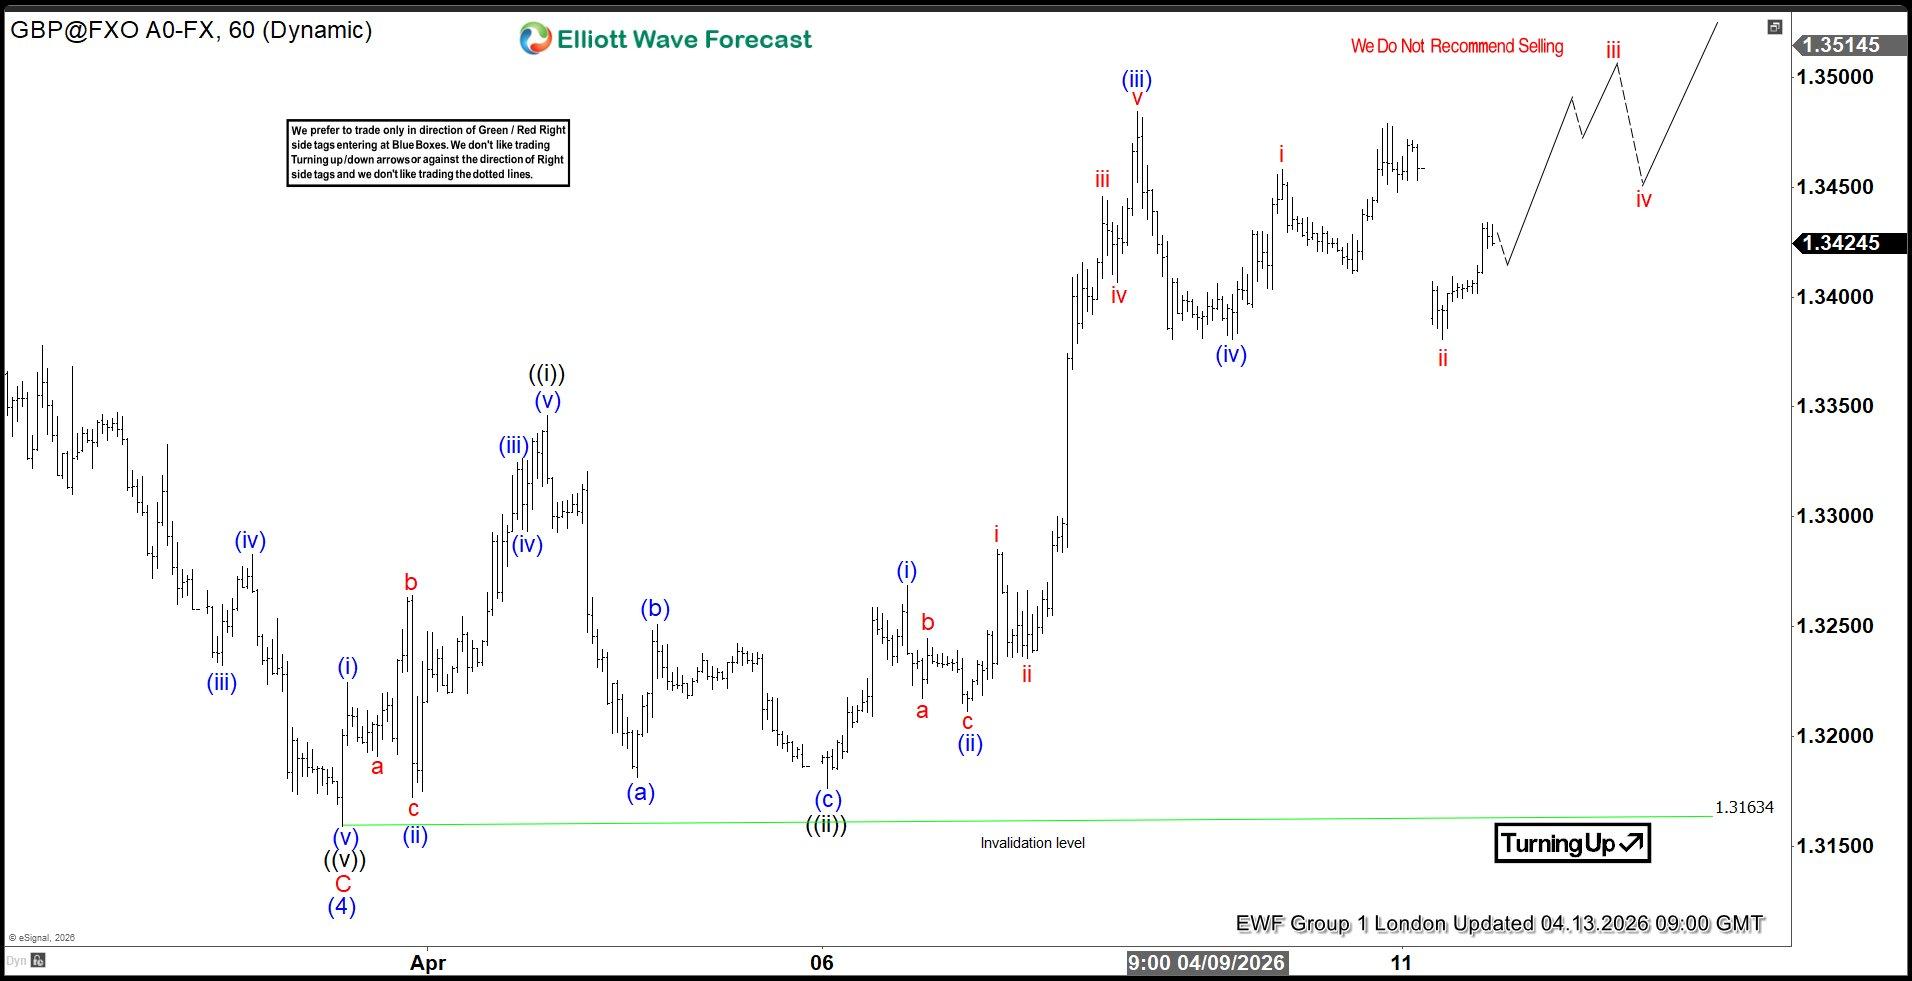
April 13 2026 we advised EWF members that the GBPUSD pair was in a bullish wave count and that a move higher was coming.

GBP/USD one-hour chart London update April 13 2026 (Bullish wave count)
GBPUSD

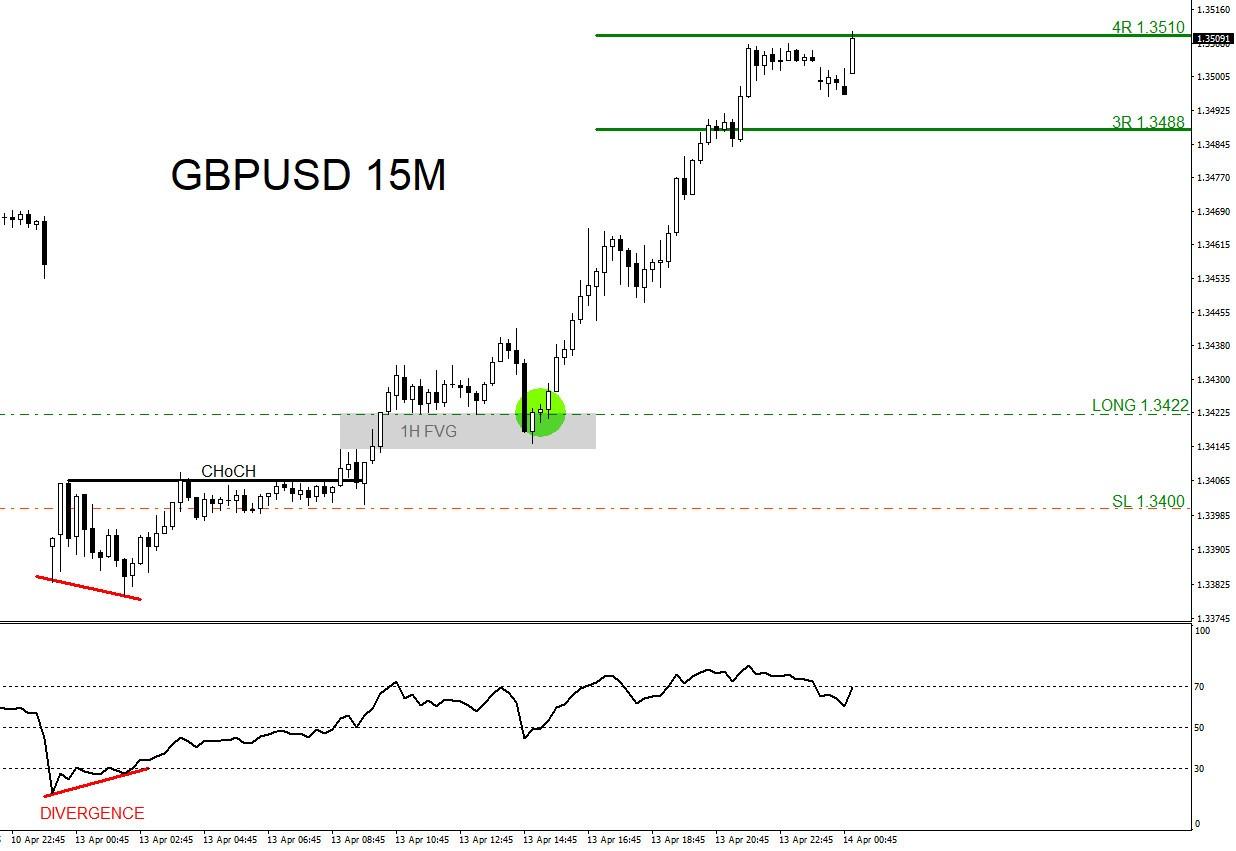
On April 13 2026 I entered the BUY trade when GBPUSD tapped the 1H FVG (Gray). Visible bullish signals, before the buy entry, was the bullish divergence pattern (Red) and the break above CHoCH level (Black) signalling more upside.

GBP/USD 15 minute chart April 13 2026
Chart

GBP/USD moves higher and on April 13 2026 price hits the 4R target at 1.3510 from 1.3422 and I closed the buy trade for +88 pips (+4% gain risking 1% on every trade).

Author

Elliott Wave Forecast Team

Elliott Wave Forecast Team

ElliottWave-Forecast.com

More from Elliott Wave Forecast Team

Share:

Editor's Picks

AUD/USD remains depressed below 0.6750 after RBA minutes

AUD/USD treads water below 0.6750 in Asia on Tuesday, struggling near ten-month lows. The pair fails to find any inspiration from RBA Governor Bullock’s hawkish remarks. Moreover, Minutes from the November RBA meeting also had little impact on the Australian Dollar amid a bullish US Dollar undertone, bolstered by firming Fed hike bets and geopolitical uncertainties.

USD/JPY holds steady around 156.50 as 'Yentervention' risks loom

USD/JPY is consolidating around mid-156.00s in the Asian session on Tuesday as traders stay on high alert amid speculation that authorities will step in to support the Japanese Yen. Meanwhile, the US Dollar holds its recent gains at a 19-month high, amid firming Fed rate-hike bets and geopolitical uncertainty. This, along with the wide US-Japan rate differential, acts as a tailwind for the pair.


Gold hangs near YTD low, around $3,850 amid Fed hike bets, bullish USD

Gold oscillates around $3,850 during the Asian session on Tuesday, trading just above its lowest level since October 2025, which it touched the previous day. Bets that the US Fed will raise borrowing costs again in December support elevated bond yields. Moreover, Middle East uncertainties help the US Dollar preserve its recent gains to a 19-month high and cap bullion.

What to watch this week as Bitcoin falls below $65K
Bitcoin holds below $65,000 on Monday amid ongoing selling pressure across cryptocurrency markets, facing a growing number of headwinds. Hawkish Federal Reserve expectations, concerns over the regulatory outlook and potential rotation out of crypto ahead of Anthropic's IPO have all raised concerns about the price.
The week ahead: Questions for the new Nvidia CEO, Anthropic’s IPO and economic data dump
The tech stock rout does not look to be over, and could be broadening as we start a new week. Nvidia’s stock price is lower by another 2% in the pre market, and its rivals, that had benefited from the chip giant’s initial demise, are also playing catch up this morning. AMD’s share price is lower by 4.2% in early trading, even though it eked out a gain last week.
Gold isn't being sold for thew reason most people think
Gold (XAU/USD) remains under heavy selling pressure on Monday, hitting its lowest level in 13 months. The precious metal is struggling to recover despite escalating geopolitical tensions in the Middle East, a backdrop that would normally encourage investors to seek protection in safe-haven assets. However, the main driver behind Gold's decline is not the geopolitical uncertainty itself.