GBP/USD finds support: Geopolitics already priced in, focus on Bank of England

GBP/USD rose to 1.3506 on Tuesday. Sterling has moved comfortably away from last week's one-month high of 1.3480. Pressure on the currency had previously increased following the collapse of US-Iran talks over the weekend.
The breakdown in dialogue followed Tehran's refusal to abandon its nuclear program and disagreements over the terms of the agreement, which the Iranian side described as excessive. Against this backdrop, Donald Trump threatened to block the Strait of Hormuz, a critical oil supply route. This pushed Brent crude prices to 102.00 USD per barrel.
Oil has become markedly more expensive, adding tension to the already strained global energy situation and raising the risks of an inflationary shock. As a result, market expectations have shifted towards a tighter Bank of England policy.
As a result, investors are now pricing in at least one interest rate hike by the end of 2026.
Technical analysis
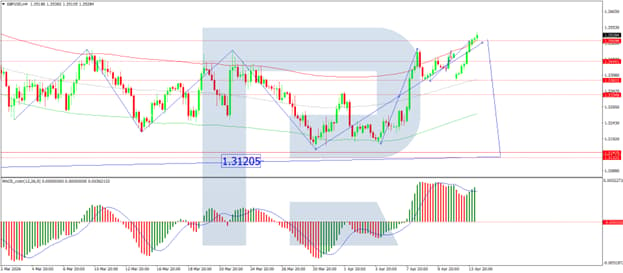
On the H4 GBP/USD chart, the market is forming a wide consolidation range around the 1.3333 level, currently extending up to 1.3535. A decline to 1.3333 is expected in the near term. Following the completion of this correction, a new consolidation range is likely to form. An upside breakout would open potential for a continuation wave to 1.3411, while a downside breakout would suggest further movement to 1.3120. Technically, this scenario is confirmed by the MACD indicator, whose signal line is above the zero level and pointing firmly downwards.
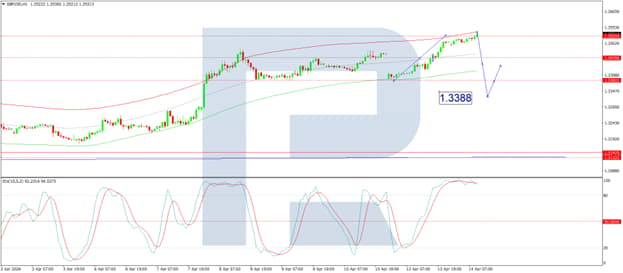
On the H1 chart, the market formed a compact consolidation range around the 1.3455 level and, with an upside breakout, completed a wave structure to 1.3535. The start of a decline towards the 1.3388 level is now expected. Technically, this scenario is confirmed by the Stochastic oscillator, with its signal line above the 80 level and pointing firmly downwards towards 20.
Conclusion
GBP/USD has found support as markets appear to have largely priced in the latest geopolitical escalation following failed US-Iran talks. Trump's threat to block the Strait of Hormuz has sent oil prices above 102.00 USD per barrel, intensifying inflationary concerns and shifting expectations towards tighter Bank of England policy, with at least one rate hike now priced for 2026. While sterling has shown resilience, the broader outlook remains clouded by risks related to the energy market. Technical indicators suggest a near-term pullback is likely, but the pair's direction will ultimately depend on whether geopolitical tensions continue to escalate or show signs of easing.
Author

RoboForex Analysis Department
RoboForex
RoboForex Analysis Department provides timely market insights, expert technical analysis, and actionable forecasts across forex, commodities, indices, and equities.