|

GBP/USD Elliott Wave outlook: Downside extension and critical wave count [Video]

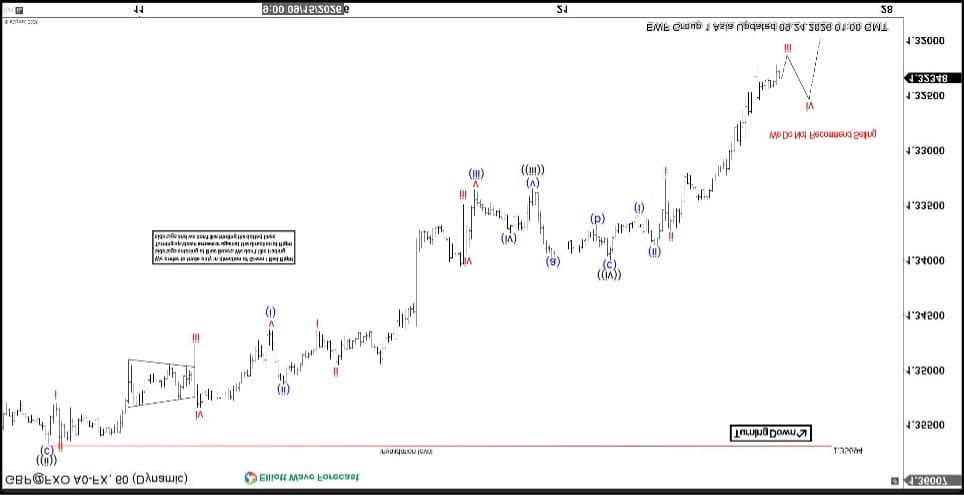
GBPUSD continues to unfold a short‑term decline from the August 21, 2026 high, developing as a five‑wave impulse. From that peak, wave ((i)) concluded at 1.3474, followed by a corrective rally in wave ((ii)) that ended at 1.3569. The pair then resumed lower in wave ((iii)), reaching 1.3335, before a modest rally in wave ((iv)) concluded at 1.34. Price action now suggests that wave ((v)) is nearing completion, which should finalize the cycle from the August 21 high. Once this impulse ends, the pair is expected to stage a three‑wave corrective rally to retrace the decline before resuming its broader bearish trend.

The technical picture becomes more compelling if GBPUSD breaks below the June 24, 2026 low at 1.314. Such a move would confirm five swings down from the August 21 high, reinforcing the view of a double three corrective structure labeled (W)‑(X)‑(Y). This development would favor further downside and open the path toward an extended target zone. The extreme area is defined by the 100% to 161.8% Fibonacci extension of wave (W), which projects into the 1.249 to 1.294 region. This zone represents the next critical support cluster and should attract significant market attention. The overall sequence highlights the persistence of bearish momentum, with corrective rallies likely to fail and give way to renewed weakness.

GBP/USD 60 minute Elliott Wave chart
GBP/USD Elliott Wave [Video]
Youtube preview

Author

Elliott Wave Forecast Team

Elliott Wave Forecast Team

ElliottWave-Forecast.com

More from Elliott Wave Forecast Team
Share:

Editor's Picks

AUD/USD turns lower toward 0.7000 after mixed Australian jobs data

AUD/USD is losing ground toward 0.7000 in the Asian session on Thursday, following the release of the Australian August jobs report, which showed that the Unemployment Rate rose to 4.6% versus 4.5% expected, while Employment Change beat estimates, arriving at 39.5K. Traders also remain unnerved ahead of the critical Trump-Xi meeting.

USD/JPY keeps the red near 158.00 as Japanese Yen firms up

USD/JPY retreats from three-week highs and holds losses near 158.00 in the Asian session on Thursday. Surging Japanese bond yields lift the Yen amid looming intervention risks, while the US Dollar preserves overnight gains to a two-month high amid hawkish Fed bets and elevated US bond yields.

Gold braces for two-way risks as Trump-Xi meeting looms

Gold is consolidating the previous decline in Thursday’s Asian trades, at weekly lows below $4,300, awaiting the highly anticipated meeting between US President Donald Trump and his Chinese counterpart Xi Jinping later in the day.

Bitcoin rallies above major cost bases as bulls eye $96K resistance
Bitcoin (BTC) has moved above several cost bases, strengthening the structure of its recent recovery as selling pressure remains relatively subdued. In a report on Wednesday, Glassnode stated that Bitcoin’s latest move is notable because the top crypto has recovered above the True Market Mean at roughly $77,000 and the Short-Term Holder (STH) Cost Basis.
Oil price rise weighs on stocks

Rising oil prices and higher yields have thrown the equity rally off track. After the risk-on start to the week renewed gains for oil prices and yields have weighed on indices.

BoJ Recap: Not as hawkish as expected

The Bank of Japan (BoJ) raised its short-term interest-rate target to 1.25% from 1.00% in a 7-2 vote, marking another step in the normalisation of monetary policy and widely matching what everyone has been expecting for weeks.














