|

EURUSD Zigzag correction points to Elliott Wave support at 1.148–1.160 [Video]

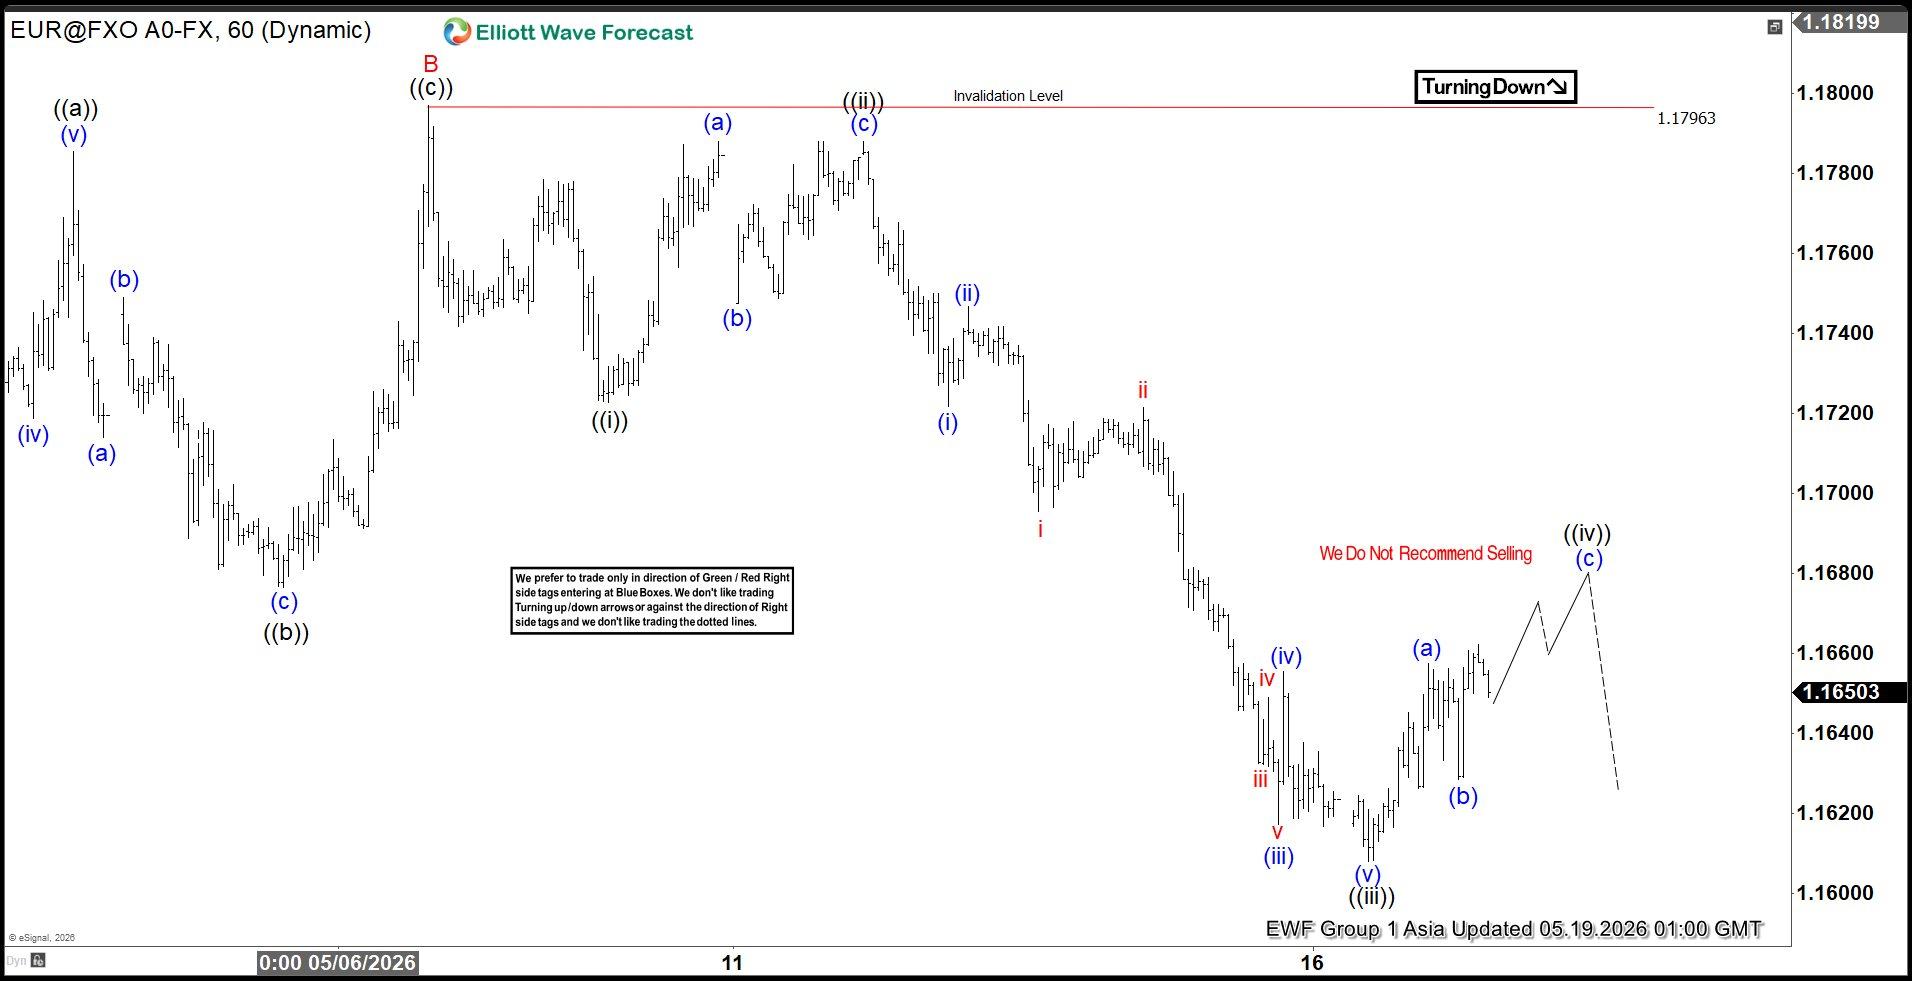
EURUSD is unfolding a corrective zigzag structure from the April 17, 2026 high. First, wave A ended at 1.1655, establishing the initial leg of the decline. Then, wave B rallied to 1.1796, as shown on the one‑hour chart. From that point onward, wave C began to progress lower, subdividing into five smaller waves. This subdivision aligns with Elliott Wave guidelines and confirms the corrective nature of the move.

Specifically, wave ((i)) concluded at 1.1722, after which wave ((ii)) rallied to 1.1788. Subsequently, the pair resumed its decline in wave ((iii)), which extended toward 1.1608. Now, wave ((iv)) is advancing as a rally. Importantly, resistance should appear in the 1.168–1.171 zone, where sellers may re‑emerge.

Moreover, as long as the pivot at 1.18 holds, rallies are likely to fail in either three or seven swings. Consequently, the bearish sequence should continue. The potential target for wave C can be projected using the Fibonacci extension of wave A. In particular, the 100%–161.8% extension range provides a reliable measurement. This calculation identifies 1.148–1.16 as the target zone. At that level, buyers are anticipated to appear. As a result, the market could attempt a new high above the April 17 peak or develop a larger three‑wave rally.

EURUSD 60-Minute Elliott Wave chart
EURUSD Elliott Wave video:
Youtube preview

Author

Elliott Wave Forecast Team

Elliott Wave Forecast Team

ElliottWave-Forecast.com

More from Elliott Wave Forecast Team

Share:

Editor's Picks

AUD/USD extends the range play above 0.7200 as traders await US inflation data

AUD/USD is seen extending its consolidative price move above 0.7200 during the Asian session on Thursday amid mixed cues. Rising RBA rate-hike bets keep the Aussie close to its highest level since May 14. However, hawkish Fed expectations and escalating US-Iran tensions offer some support to the US Dollar, capping the currency pair as traders await US inflation figures.


USD/JPY consolidates around 153.50 as bears turn cautious ahead of US inflation

USD/JPY stabilizes above 153.50 during the Asian session on Thursday, but remains near a seven-month low set earlier this week as hawkish BoJ repricing continues to underpin the Japanese Yen. Meanwhile, rising September Fed rate-hike bets and escalating US-Iran tensions help ease US Dollar selling pressure, offering some support to the currency pair ahead of US inflation figures.

Gold sticks to gains, eyes $4,450 as USD remains depressed ahead of US inflation data

Gold turns higher following an intraday dip to sub-$4,400 levels, and moves further away from a one-week low touched the previous day. The commodity, however, remains below the $4,450 pivotal point as bulls seem hesitant ahead of US inflation figures. The US Producer Price Index report will be published later today, while the US Consumer Price Index is due on Friday.

Raydium's rally signals trend reversal amid network growth, buyback

Raydium maintains a firm bullish tone, posting nearly 9% gains, and extending its 41% rally from Sunday. Solana-based Decentralized Exchange is witnessing a surge in network activity and growth amid new token launches. The technical outlook for Raydium signals a potential upside toward $1.50 as momentum holds firm despite overbought conditions.

European Central Bank to resume interest rate hikes in September as inflation, energy risks rise

The European Central Bank is expected to raise the interest rate on the Main Refinancing Operations and the Deposit Facility by 25 basis points to 2.65% and 2.50%, respectively. The ECB will announce the decision on Thursday at 12:15 GMT.

Venezuela’s 65-billion-barrel Oil deal could reshape America’s inflation fight
The United States (US) has secured unprecedented access to part of Venezuela’s vast Oil reserves. The timing is particularly significant as the war with Iran is disrupting Middle Eastern supplies, keeping energy prices elevated and reviving concerns about inflation.