CPI data torpedoes markets

USD: Jun '24 is Up at 105.080.
Energies: Apr '24 Crude is Down at 85.86.
Financials: The June '24 30 Year T-Bond is Up 4 ticks and trading at 115.22.
Indices: The Jun '24 S&P 500 emini ES contract is 67 ticks Lower and trading at 5191.00.
Gold: The Apr'24 Gold contract is trading Up at 2352.40.
Initial conclusion
This is not a correlated market. The USD is Up and Crude is Down which is normal, and the 30 Year T-Bond is trading Higher. The Financials should always correlate with the US dollar such that if the dollar is Higher, then the bonds should follow and vice-versa. The S&P is Lower and Crude is trading Lower which is not correlated. Gold is trading Higher which is not correlated with the US dollar trading Up. I tend to believe that Gold has an inverse relationship with the US Dollar as when the US Dollar is down, Gold tends to rise in value and vice-versa. Think of it as a seesaw, when one is up the other should be down. I point this out to you to make you aware that when we don't have a correlated market, it means something is wrong. As traders you need to be aware of this and proceed with your eyes wide open. All of Asia is trading Higher with the exception of the Sensex and Shanghai exchanges which are Lower. Currently all of Europe is trading Lower.
Possible challenges to traders
-
Core PPI m/m is out at 8:30 AM EST. This is Major.
-
PPI m/m is out at 8:30 AM EST. This is Major.
-
PPI y/y is out at 8:30 AM EST. This is Major.
-
Unemployment Claims are out at 8:30 AM EST. This is Major.
-
FOMC Member Williams Speaks at 8:45 AM EST. This is Major.
-
Natural Gas Storage is out at 10:30 AM EST. This is Major.
-
FOMC Member Barkin Speaks at 10 AM EST. This is Major.
-
30-y Bond Auction starts at 1 PM EST. Major.
-
FOMC Member Bostic Speaks at 1:30 PM EST. Major.
Treasuries
Traders, please note that we've changed the Bond instrument from the 30 year (ZB) to the 10 year (ZN). They work exactly the same.
We've elected to switch gears a bit and show correlation between the 10-year bond (ZN) and the S&P futures contract. The S&P contract is the Standard and Poor's, and the purpose is to show reverse correlation between the two instruments. Remember it's likened to a seesaw, when up goes up the other should go down and vice versa.
Yesterday the ZN migrated Higher at around 9:20 AM EST as the S&P hit a High at around the same time. If you look at the charts below the S&P gave a signal at around 9:20 AM and the ZN started its Upward climb. Look at the charts below and you'll see a pattern for both assets. S&P hit a High at around 9:20 AM and migrated Lower. These charts represent the newest version of MultiCharts and I've changed the timeframe to a 15-minute chart to display better. This represented a Long opportunity on the 10-year note, as a trader you could have netted about a dozen ticks per contract on this trade. Each tick is worth $15.625. Please note: the front month for both the ZN and the S&P are now Jun '24. I've changed the format to filled Candlesticks (not hollow) such that it may be more apparent and visible.
Charts courtesy of MultiCharts built on an AMP platform
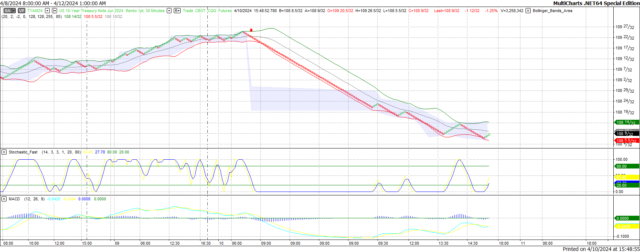
ZN -Jun 2024 - 04/10/24
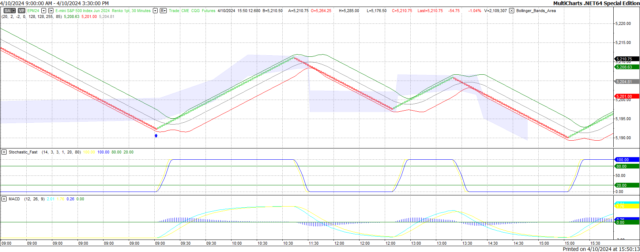
S&P - Mar 2024 - 04/10/24
Bias
Yesterday we gave the markets a Neutral bias as we didn't much in the way of Market Correlation Wednesday morning. The markets clearly dropped dramatically yesterday as the Dow lost 422 points, the S&P dropped 49 and even the mighty Nasdaq dropped 136 points. Today we aren't dealing with a correlated market and our bias is to the Downside.
Could this change? Of Course. Remember anything can happen in a volatile market.
Commentary
Yesterday when we created our daily morning broadcast, we said that much of what happens today will be predicated upon the economic news reported. The markets lost no time in reacting to the news reported. The Consumer Price Index (CPI) was the highest reported in 12 months and the indices dropped like a rock on this news. The dropped by over 400 points and the other indices lost ground as well. The significance of this is the Federal Reserve will be more reluctant in wanting to lower interest rates. At this point no one knows when or even if the Fed will lower. They claim they'll do 3 cuts this year but this is predicated upon the economic news reported and should we experience more reports like today; the Fed will be hard pressed to justify a rate reduction. Today we have PPI numbers which the producers and suppliers of products and services use to determine pricing on their end. Think of it as CPI for manufacturing.
Author

Nick Mastrandrea
Market Tea Leaves
Nick Mastrandrea over 20 years experience in trading and formerly held a NASD Series 7. He currently holds a NJ Life, Health and Variable Authority. Nick is a published writer and his work has appeared in Futures Magazine, TraderPlanet and others.


