WTI rebounds while traders monitor fresh developments in the Strait of Hormuz
- WTI climbs over 2% on Thursday, recovering from its lowest level in more than three months.
- Improving traffic through the Strait of Hormuz eases supply concerns, though fresh Middle East risks keep traders cautious.
- Technical indicators remain bearish, with WTI holding below key moving averages and the RSI hovering near oversold levels.

West Texas Intermediate (WTI) crude Oil edges higher on Thursday, snapping a three-day losing streak as short covering lifts prices following the recent selloff to a more than three-month low. At the time of writing, WTI is trading around $71.50, up more than 2% on the day.
Despite the intraday uptick, Oil prices remain around levels last seen at the start of the US-Iran war as traffic through the Strait of Hormuz continues to improve, easing supply concerns.
However, the situation in the Middle East remains fluid. Iran said that only routes designated by Tehran are permitted for transit through the Strait of Hormuz and that vessels must obtain approval from the Islamic Revolutionary Guard Corps (IRGC) before entering the waterway. Iranian authorities have reportedly turned back ships attempting to use the new southern route.
Separately, reports of a vessel being struck off the coast of Oman revived some geopolitical risk premium.
Meanwhile, US Secretary of State Marco Rubio downplayed Iran's plans to impose transit tolls in the Strait of Hormuz, saying there is "zero support among Gulf countries for tolling in Hormuz."
Analysts at TD Securities, Ryan McKay and Bart Melek, said crude Oil flows through the Strait of Hormuz are gradually normalizing, although around 10-11 million barrels per day of Middle Eastern production remain offline.
"Without a swift recovery in Middle East production in the coming weeks, continued inventory draws and bloated short positioning will create an ideal setup for a recovery in crude oil prices," the strategists said.
Data from the Energy Information Administration (EIA) on Wednesday showed crude stockpiles fell by 6.088 million barrels last week, compared with expectations for a 5.1 million-barrel decline. However, the drop was smaller than the previous week's 8.262 million-barrel draw.
Technical Analysis:
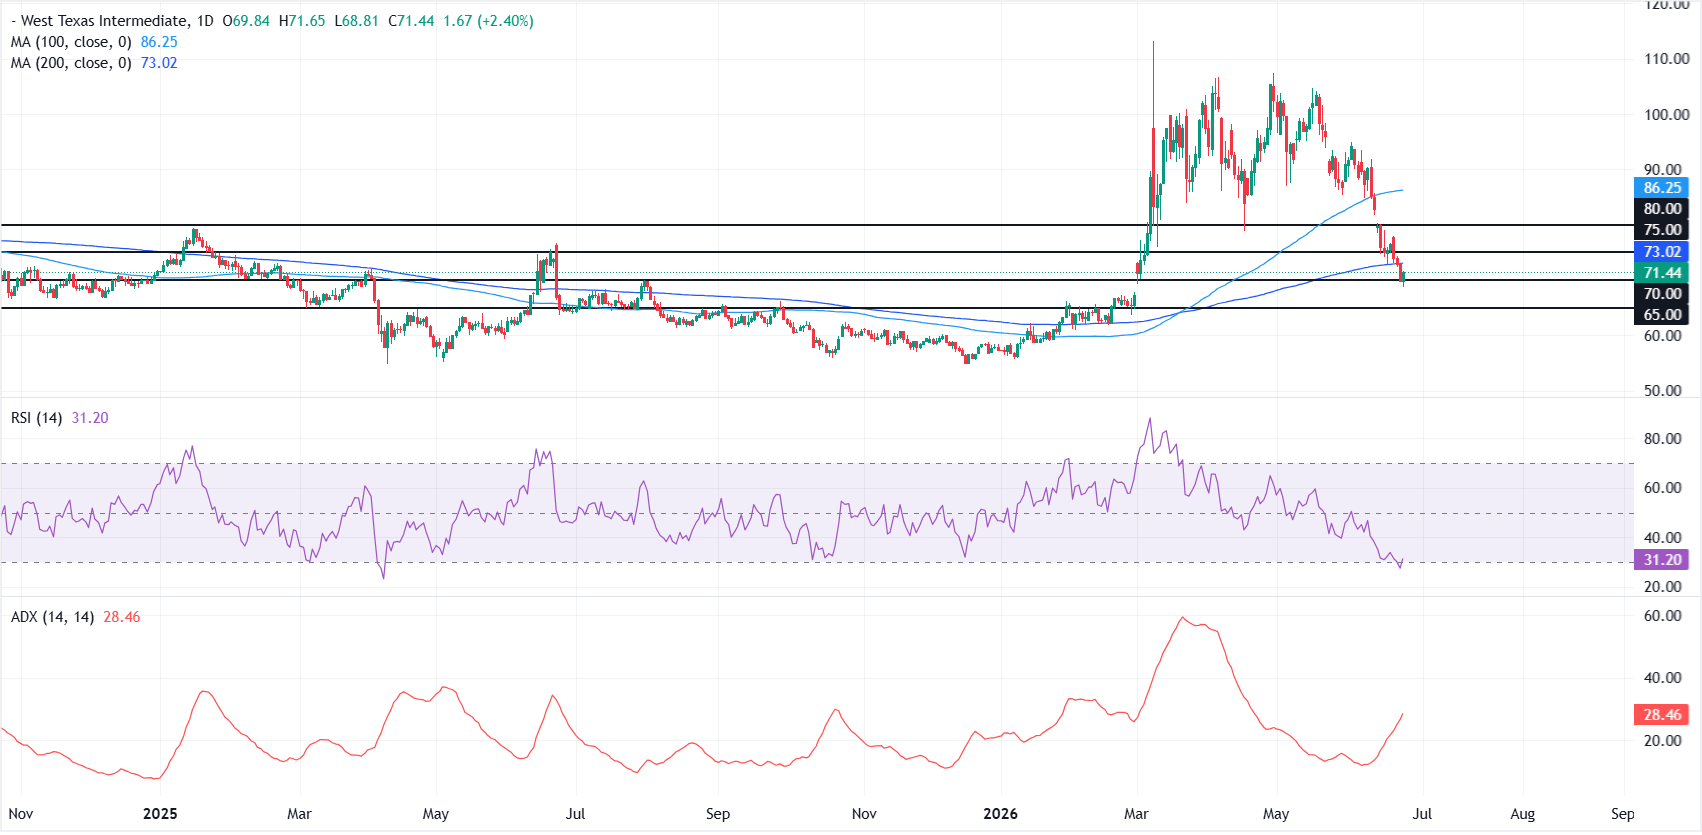
In the daily chart, WTI maintains a bearish near-term bias as it holds below the 200-day Simple Moving Average (SMA) at $73.02 and well under the 100-day SMA at $86.25.
The rising Average Directional Index (ADX) near 28 suggests building trend strength, while the Relative Strength Index (RSI) around 32 hovers just above oversold territory, hinting that while downside pressure persists, the pace of the recent sell-off could start to moderate.
On the downside, immediate support is seen at the $70.00 horizontal level, ahead of a deeper floor near $65.00.
On the topside, initial resistance is provided by the 200-day SMA at $73.02, followed by the $75.00 and $80.00 horizontal barriers, with the distant 100-day SMA at $86.25 reinforcing a broader cap on recovery attempts unless buyers reclaim higher ground.
(The technical analysis of this story was written with the help of an AI tool.)
WTI Oil FAQs
WTI Oil is a type of Crude Oil sold on international markets. The WTI stands for West Texas Intermediate, one of three major types including Brent and Dubai Crude. WTI is also referred to as “light” and “sweet” because of its relatively low gravity and sulfur content respectively. It is considered a high quality Oil that is easily refined. It is sourced in the United States and distributed via the Cushing hub, which is considered “The Pipeline Crossroads of the World”. It is a benchmark for the Oil market and WTI price is frequently quoted in the media.
Like all assets, supply and demand are the key drivers of WTI Oil price. As such, global growth can be a driver of increased demand and vice versa for weak global growth. Political instability, wars, and sanctions can disrupt supply and impact prices. The decisions of OPEC, a group of major Oil-producing countries, is another key driver of price. The value of the US Dollar influences the price of WTI Crude Oil, since Oil is predominantly traded in US Dollars, thus a weaker US Dollar can make Oil more affordable and vice versa.
The weekly Oil inventory reports published by the American Petroleum Institute (API) and the Energy Information Agency (EIA) impact the price of WTI Oil. Changes in inventories reflect fluctuating supply and demand. If the data shows a drop in inventories it can indicate increased demand, pushing up Oil price. Higher inventories can reflect increased supply, pushing down prices. API’s report is published every Tuesday and EIA’s the day after. Their results are usually similar, falling within 1% of each other 75% of the time. The EIA data is considered more reliable, since it is a government agency.
OPEC (Organization of the Petroleum Exporting Countries) is a group of 12 Oil-producing nations who collectively decide production quotas for member countries at twice-yearly meetings. Their decisions often impact WTI Oil prices. When OPEC decides to lower quotas, it can tighten supply, pushing up Oil prices. When OPEC increases production, it has the opposite effect. OPEC+ refers to an expanded group that includes ten extra non-OPEC members, the most notable of which is Russia.
Author

Vishal Chaturvedi
FXStreet
I am a macro-focused research analyst with over four years of experience covering forex and commodities market. I enjoy breaking down complex economic trends and turning them into clear, actionable insights that help traders stay ahead of the curve.


