WTI Crude Oil slides below 95 as Iran risk premium cools
- WTI crude slipped over 3% to fall below 95.00 as markets weigh the duration of the Strait of Hormuz supply disruption.
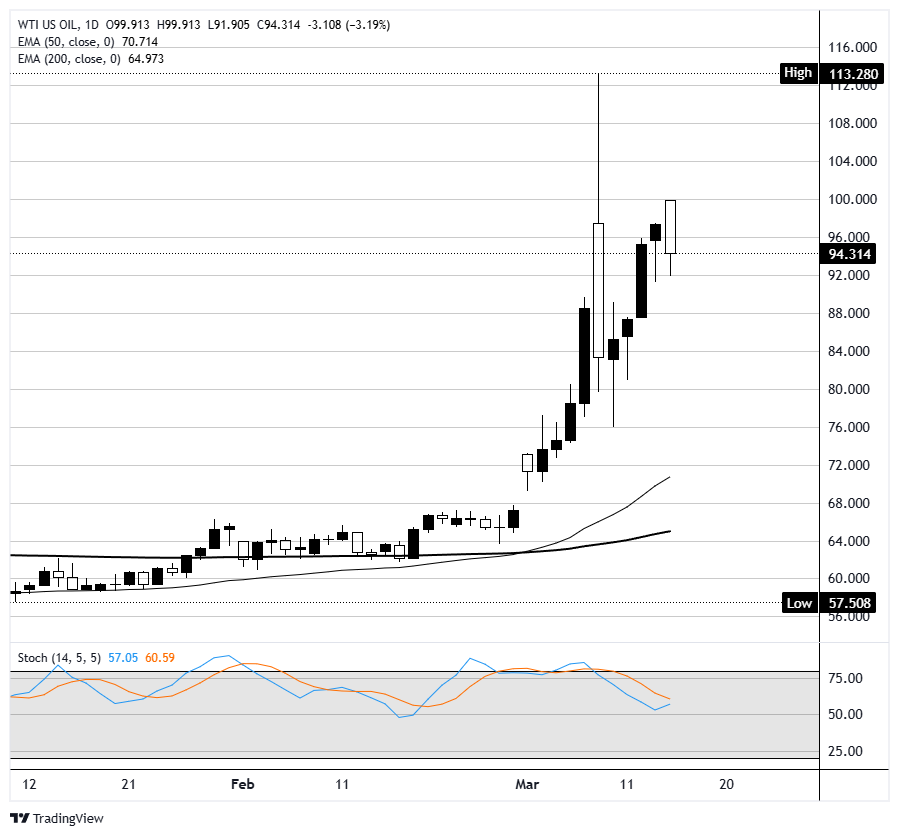
- The US-Israeli military operation against Iran and the resulting Strait of Hormuz closure drove WTI from near 65.00 in mid-February to a spike high above 113.00, triggering one of the most violent crude rallies in years.
- Attention now shifts to whether the disruption proves sustained or short-lived, with OPEC+ emergency output discussions and US Strategic Petroleum Reserve release plans both cited as potential pressure valves.

WTI crude slid over 3% on Monday, opening near 100.00 before selling off through the session to settle below 95.00 per barrel. The day's bearish candle, which opened at its high and closed in the lower half of its range, reflects a cooling of the panic-buying impulse that drove the spike to above 113.00 last week. Since that spike high, price has pulled back in a series of lower daily closes, though the broader trend remains sharply elevated relative to where crude was trading before the Strait of Hormuz closure.
The Strait of Hormuz closure, triggered by the US-Israeli military operation against Iran, removed an estimated 20% of global seaborne oil supply from the market almost overnight, driving the near-vertical rally from the mid-February breakout near 65.00.
With no clear timeline for the reopening of the strait and tanker re-routing adding days to delivery schedules, the supply shock remains the dominant fundamental driver. Reports that the White House is considering a coordinated release from the Strategic Petroleum Reserve (SPR) have provided some downward pressure at the margin, though traders appear skeptical that it would meaningfully offset the disruption.
On the demand side, elevated prices are beginning to raise demand destruction concerns, particularly from Asian importers. China's National Development and Reform Commission flagged plans to draw down state reserves rather than purchase at spot, while India has accelerated talks with alternative Middle Eastern producers outside the strait corridor. These dynamics are adding a ceiling to the rally even as the underlying supply shock persists.
WTI daily chart
WTI Oil FAQs
WTI Oil is a type of Crude Oil sold on international markets. The WTI stands for West Texas Intermediate, one of three major types including Brent and Dubai Crude. WTI is also referred to as “light” and “sweet” because of its relatively low gravity and sulfur content respectively. It is considered a high quality Oil that is easily refined. It is sourced in the United States and distributed via the Cushing hub, which is considered “The Pipeline Crossroads of the World”. It is a benchmark for the Oil market and WTI price is frequently quoted in the media.
Like all assets, supply and demand are the key drivers of WTI Oil price. As such, global growth can be a driver of increased demand and vice versa for weak global growth. Political instability, wars, and sanctions can disrupt supply and impact prices. The decisions of OPEC, a group of major Oil-producing countries, is another key driver of price. The value of the US Dollar influences the price of WTI Crude Oil, since Oil is predominantly traded in US Dollars, thus a weaker US Dollar can make Oil more affordable and vice versa.
The weekly Oil inventory reports published by the American Petroleum Institute (API) and the Energy Information Agency (EIA) impact the price of WTI Oil. Changes in inventories reflect fluctuating supply and demand. If the data shows a drop in inventories it can indicate increased demand, pushing up Oil price. Higher inventories can reflect increased supply, pushing down prices. API’s report is published every Tuesday and EIA’s the day after. Their results are usually similar, falling within 1% of each other 75% of the time. The EIA data is considered more reliable, since it is a government agency.
OPEC (Organization of the Petroleum Exporting Countries) is a group of 12 Oil-producing nations who collectively decide production quotas for member countries at twice-yearly meetings. Their decisions often impact WTI Oil prices. When OPEC decides to lower quotas, it can tighten supply, pushing up Oil prices. When OPEC increases production, it has the opposite effect. OPEC+ refers to an expanded group that includes ten extra non-OPEC members, the most notable of which is Russia.
Author

Joshua Gibson
FXStreet
Joshua joins the FXStreet team as an Economics and Finance double major from Vancouver Island University with twelve years' experience as an independent trader focusing on technical analysis.