USDSGD blue box setup yields 130 pips for short-term sellers

Since January 2025, the dollar has faced a significant sell-off after completing the bullish cycle from July 2023. Meanwhile, this sell-off was part of the continuation of the larger bearish cycle from September 2022. At the mature stage of the impulse sequence from January, we recommended selling dollar bounces to our members. In a clear bearish sequence, we favor selling bounces.
Meanwhile, the USDSGD pair was one of the dollar pairs exhibiting a 3/7 swing bounce. Therefore, we aimed to sell the dollar against the Singaporean Dollar (i.e., the USDSGD pair). It is important to note that selling USDSGD was based on a thorough independent analysis of the pair.
From a long-term perspective, USDSGD completed a 5-wave decline from its record high. After this 5-wave decline ended in July 2011, a 3-wave corrective cycle was expected to follow—upside in this case. The bullish corrective cycle from July 2011 completed its first leg—supercycle degree wave (a)—in March 2020. Since March 2020, the supercycle degree wave (b) has been moving lower to correct the rally from July 2011. After completing a 5-swing sequence in September 2024, the pair bounced to correct it. This corrective bounce ended in January 2025, followed by a significant sell-off primarily driven by a bearish dollar.
USDSGD blue box setup: 2nd May, 2025 update
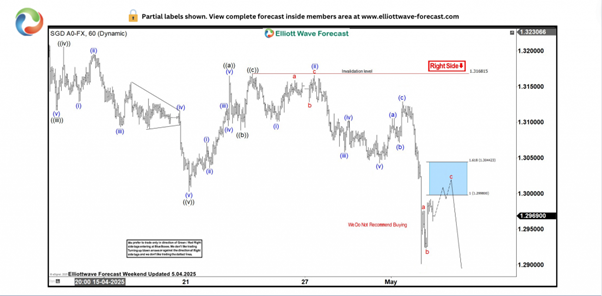
USDSGD H1 Chart
On May 2, 2025, we identified a clear corrective bounce emerging after the price broke below the lows of April 2025. We marked the 1.2998–1.3044 range as the blue box zone where new sellers would likely appear and/or existing sellers might add to their positions. Therefore, we recommended to our members to sell the pair from this zone, with a stop slightly above 1.3044. We anticipated taking profits within the 1.2892–1.2878 range, expecting it to be a short-term, fast trade.
USDSGD blue box setup: 7th May, 2025 update
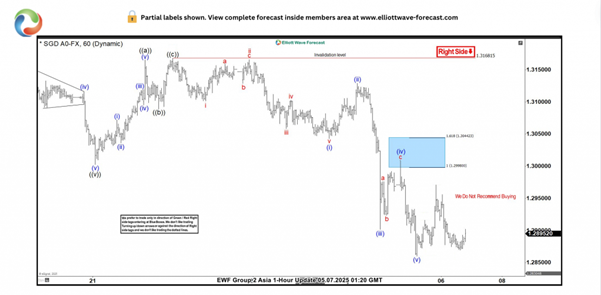
USDSGD H1 Chart
On May 7, 2025, we shared the chart above with members (partial labels shown). The price displayed a perfect reaction from the blue box as members went short from that area. Short positions were triggered within the blue box on May 2. Subsequently, on May 5, 2025, price hit the target zone, allowing members to book 100–120 pips in profits in just five days.
What’s next for USDSGD?
While the dollar’s bearish cycle from September 2022 remains incomplete, we intend to continue selling bounces on this pair and related pairs. We have our own method of determining when a cycle ends and another begins. When the current bearish cycle on the dollar concludes, members will be informed and can adjust their expectations while preparing for the next cycle.
Author

Elliott Wave Forecast Team
ElliottWave-Forecast.com
















