USD/JPY steadies after intervention-driven slump
- USD/JPY stabilizes after a sharp drop as Tokyo intervention warnings boost the Yen.
- Japanese authorities are suspected of FX intervention; no official confirmation yet.
- Technically, the latest leg lower in USD/JPY has pushed the pair below the 50- and 100-day SMAs on the daily chart.

USD/JPY shows signs of stabilizing after a sharp intraday slump on Thursday triggered by intervention warnings from Tokyo, which sent the Japanese Yen (JPY) soaring across the board. At the time of writing, the pair is trading around 156.61 after hitting an intraday low of 155.56, its lowest level since February 27, though it remains down about 2.4% on the day.
Meanwhile, the US Dollar Index (DXY), which tracks the Greenback's value against a basket of six major currencies, is trading around 98.28, down nearly 0.68%. However, ongoing tensions in the Middle East could limit deeper losses in the US Dollar (USD).
According to Reuters, citing a Nikkei report based on a government source, Japanese authorities may have intervened in the foreign exchange market by buying Yen and selling Dollars on Thursday. However, there has been no official confirmation so far. This comes after Japan Finance Minister Satsuki Katayama said earlier that authorities are “getting closer to taking decisive steps” in the FX market.
On the US side, the latest economic data pointed to steady growth despite heightened geopolitical tensions. The US economy expanded at an annualized rate of 2% in the first quarter of 2026, up from 0.5% in the previous quarter but below market expectations of 2.3%, according to a preliminary estimate.
The Personal Consumption Expenditure (PCE) price index rose 0.7% MoM in March, accelerating from 0.4% in February and marking the strongest gain since June 2022. Meanwhile, the core PCE index, the Federal Reserve’s (Fed) preferred gauge, increased by 0.3% MoM, easing slightly from 0.4% in February and coming in line with forecasts.
The data support the view that the Fed may keep interest rates higher for longer as policymakers assess the impact of the US-Iran war on the economy. Speaking after Wednesday’s monetary policy decision, Fed Chair Jerome Powell said the current policy stance is “well positioned” to adopt a wait-and-see approach.
Looking ahead, USD/JPY is likely to remain highly sensitive to headlines from Tokyo. At the same time, traders will continue to monitor developments in the Middle East, particularly around the reopening of the Strait of Hormuz, as elevated Oil prices remain a near-term headwind for the Japanese Yen.
Technical Analysis:
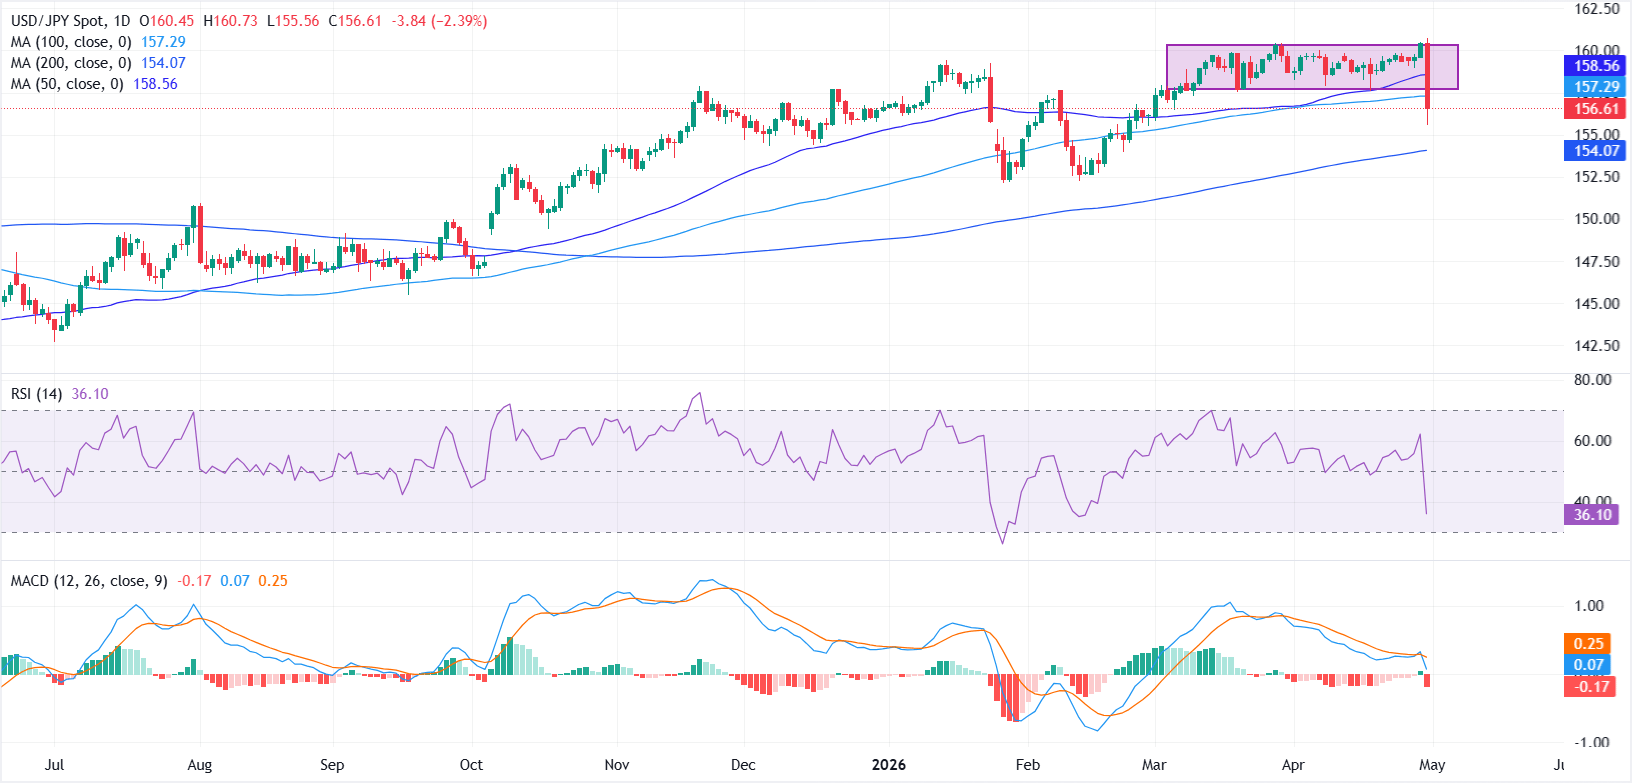
On the daily chart, USD/JPY is in a corrective pullback and has slipped below the 50-day and 100-day Simple Moving Averages (SMAs), reinforcing a bearish near-term bias.
Momentum has weakened, with the Relative Strength Index (RSI) sliding toward the mid-30s, pointing to rising bearish pressure, while the Moving Average Convergence Divergence (MACD) has crossed below its signal line and moved into negative territory, suggesting downside momentum is building despite recent volatility.
On the topside, initial resistance is seen at the 100-day SMA around 157, with a stronger cap at the 50-day SMA near 158.56 that guards the path toward the recent highs. On the downside, initial support emerges at the 200-day SMA near 154, where longer-term buyers could attempt to slow the decline if the pair extends its slide
(The technical analysis of this story was written with the help of an AI tool.)
US Dollar Price Today
The table below shows the percentage change of US Dollar (USD) against listed major currencies today. US Dollar was the strongest against the Canadian Dollar.
| USD | EUR | GBP | JPY | CAD | AUD | NZD | CHF | |
|---|---|---|---|---|---|---|---|---|
| USD | -0.30% | -0.53% | -2.35% | -0.28% | -0.82% | -0.82% | -0.90% | |
| EUR | 0.30% | -0.21% | -2.13% | 0.01% | -0.51% | -0.51% | -0.58% | |
| GBP | 0.53% | 0.21% | -1.89% | 0.23% | -0.29% | -0.29% | -0.38% | |
| JPY | 2.35% | 2.13% | 1.89% | 2.16% | 1.62% | 1.56% | 1.49% | |
| CAD | 0.28% | -0.01% | -0.23% | -2.16% | -0.55% | -0.57% | -0.63% | |
| AUD | 0.82% | 0.51% | 0.29% | -1.62% | 0.55% | 0.00% | -0.16% | |
| NZD | 0.82% | 0.51% | 0.29% | -1.56% | 0.57% | 0.00% | -0.08% | |
| CHF | 0.90% | 0.58% | 0.38% | -1.49% | 0.63% | 0.16% | 0.08% |
The heat map shows percentage changes of major currencies against each other. The base currency is picked from the left column, while the quote currency is picked from the top row. For example, if you pick the US Dollar from the left column and move along the horizontal line to the Japanese Yen, the percentage change displayed in the box will represent USD (base)/JPY (quote).
Author

Vishal Chaturvedi
FXStreet
I am a macro-focused research analyst with over four years of experience covering forex and commodities market. I enjoy breaking down complex economic trends and turning them into clear, actionable insights that help traders stay ahead of the curve.

















