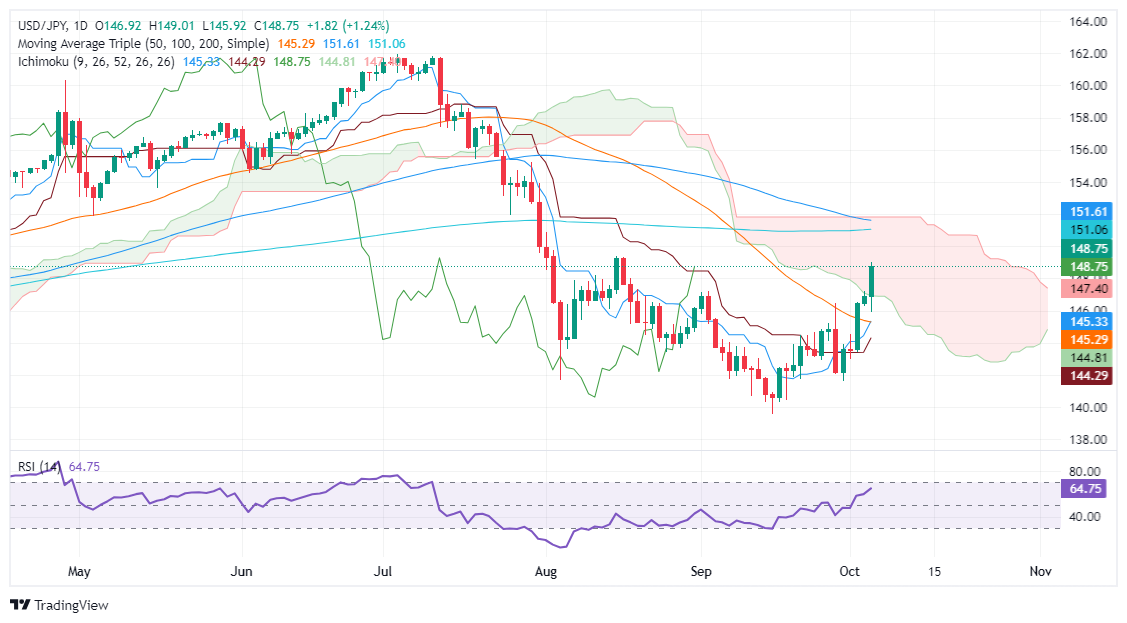
USD/JPY Price Forecast: Skyrockets and climbs above 148.00
- USD/JPY rallies over 1% after US Nonfarm Payrolls added 254K jobs, lifting US Treasury yields.
- Bulls target a decisive break above 149.39 and 150.00, with next resistance at the 200-DMA of 151.06.
- Support lies at 148.00, followed by the Senkou Span B at 147.78 and the bottom of the Ichimoku Cloud at 146.90-147.00.

The USD/JPY rallied sharply inside the Ichimoku cloud (Kumo) after the US Bureau of Labor Statistics (BLS) revealed that the latest jobs report added over 254K employees to the workforce. This underpinned US Treasury yields, which lifted the exchange rate to current price levels due to their close correlation with the pair. The major trades at 148.73, up by over 1%.
USD/JPY Price Forecast: Technical outlook
The USD/JPY aimed higher, yet it remains far from turning bullish. Despite this, bulls are in charge in the short term, eyeing a decisive break above the August 15 high of 149.39 and the 150.00 figure.
The Relative Strength Index (RSI) is bullish, aiming upwards, suggesting further upside is seen in the USD/JPY pair.
If buyers clear 150.00, the next resistance would be the 200-day moving average (DMA) at 151.06. On further strength, that will expose the 100-DMA at 151.94.
Conversely, the USD/JPY first support would be the 148.00 figure. Once surrendered, the first support would be the Senkou Span B at 147.78, followed by the bottom of the Kumo at 146.90-147.00.
USD/JPY Price Action – Daily Chart
Japanese Yen PRICE Today
The table below shows the percentage change of Japanese Yen (JPY) against listed major currencies today. Japanese Yen was the strongest against the New Zealand Dollar.
| USD | EUR | GBP | JPY | CAD | AUD | NZD | CHF | |
|---|---|---|---|---|---|---|---|---|
| USD | 0.52% | -0.02% | 1.22% | 0.15% | 0.64% | 0.85% | 0.72% | |
| EUR | -0.52% | -0.52% | 0.72% | -0.35% | 0.11% | 0.35% | 0.18% | |
| GBP | 0.02% | 0.52% | 1.25% | 0.18% | 0.64% | 0.86% | 0.69% | |
| JPY | -1.22% | -0.72% | -1.25% | -1.07% | -0.59% | -0.40% | -0.54% | |
| CAD | -0.15% | 0.35% | -0.18% | 1.07% | 0.47% | 0.72% | 0.52% | |
| AUD | -0.64% | -0.11% | -0.64% | 0.59% | -0.47% | 0.22% | 0.03% | |
| NZD | -0.85% | -0.35% | -0.86% | 0.40% | -0.72% | -0.22% | -0.18% | |
| CHF | -0.72% | -0.18% | -0.69% | 0.54% | -0.52% | -0.03% | 0.18% |
The heat map shows percentage changes of major currencies against each other. The base currency is picked from the left column, while the quote currency is picked from the top row. For example, if you pick the Japanese Yen from the left column and move along the horizontal line to the US Dollar, the percentage change displayed in the box will represent JPY (base)/USD (quote).
Author

Christian Borjon Valencia
FXStreet
Markets analyst, news editor, and trading instructor with over 14 years of experience across FX, commodities, US equity indices, and global macro markets.


