USD/JPY Price Forecast: Clings around 158.00 on risk-off mood
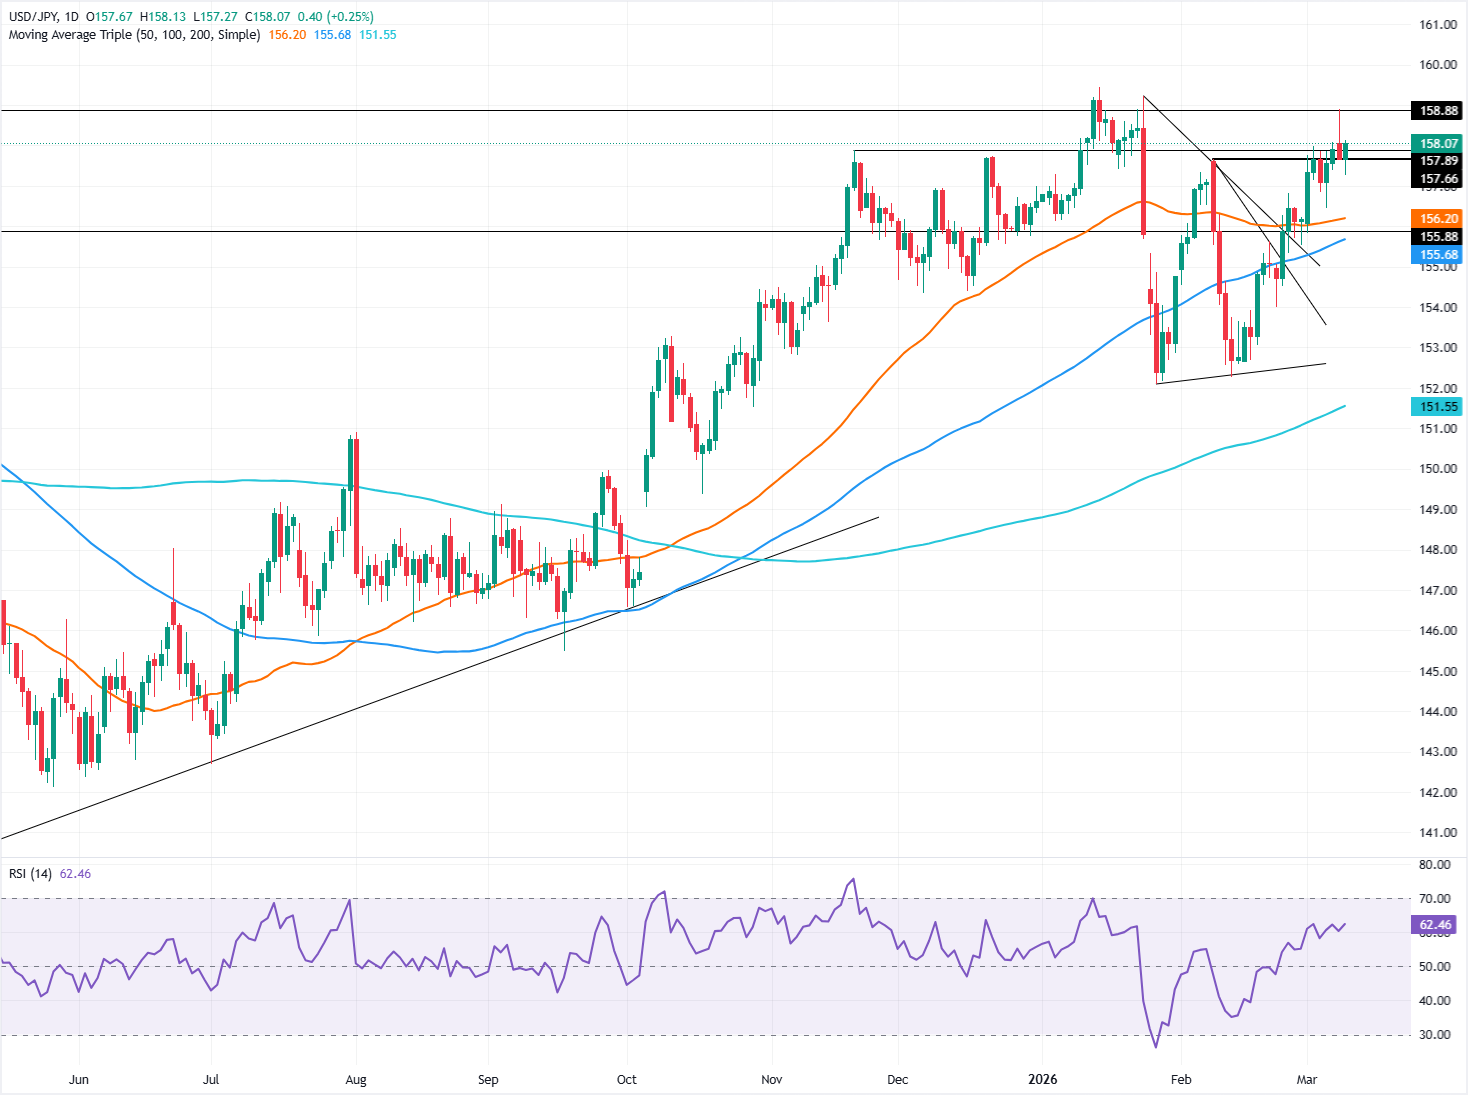
- USD/JPY climbs to 158.07 after bouncing from a three-day low of 157.27.
- Break above 158.90 could trigger intervention fears near the 159–160 zone.
- Drop below 158.00 exposes 156.46, followed by the 50-day SMA near 156.20.

The USD/JPY edges higher on Tuesday, rising nearly 0.25% as risk appetite deteriorated late in the New York session, even though the US President Donald Trump hinted a de-escalation of the conflict. At the time of writing the pair trades at 158.07 some 80 pips above its opening price.
USD/JPY Price Forecast: Technical outlook
The technical picture is slightly bearish with the USD/JPY registering a shooting star candle on Monday. Although Tuesday’s price action formed a bullish candle, revealed that sellers drove prices to a three-day low of 157.27, which opens the door for further downside.
The Relative Strength Index (RSI) shows that buyers are gathering steam, about to reach overbought territory.
If USD/JPY resumes its uptrend, the first area of interest would be the March 9 high at 158.90. Once surpassed the pair will enter potential intervention zone by Japanese authorities and the Bank of Japan at around 159.00-160.00.
Conversely, if sellers stepped in, driving the USD/JPY below 158.00, it clears the path for further downside. The next demand zone will be the March 5 swing low of 156.46, ahead of the 50-day Simple Moving Average (SMA) at156.20, ahead of the 100-day SMA At 155.68.
USD/JPY Price Chart — Daily
Japanese Yen Price This week
The table below shows the percentage change of Japanese Yen (JPY) against listed major currencies this week. Japanese Yen was the strongest against the US Dollar.
| USD | EUR | GBP | JPY | CAD | AUD | NZD | CHF | |
|---|---|---|---|---|---|---|---|---|
| USD | -0.55% | -0.58% | 0.00% | -0.16% | -1.90% | -1.06% | -0.14% | |
| EUR | 0.55% | -0.05% | 0.55% | 0.37% | -1.37% | -0.54% | 0.40% | |
| GBP | 0.58% | 0.05% | 0.62% | 0.42% | -1.33% | -0.49% | 0.44% | |
| JPY | 0.00% | -0.55% | -0.62% | -0.13% | -1.87% | -1.05% | -0.10% | |
| CAD | 0.16% | -0.37% | -0.42% | 0.13% | -1.75% | -0.91% | 0.02% | |
| AUD | 1.90% | 1.37% | 1.33% | 1.87% | 1.75% | 0.84% | 1.80% | |
| NZD | 1.06% | 0.54% | 0.49% | 1.05% | 0.91% | -0.84% | 0.94% | |
| CHF | 0.14% | -0.40% | -0.44% | 0.10% | -0.02% | -1.80% | -0.94% |
The heat map shows percentage changes of major currencies against each other. The base currency is picked from the left column, while the quote currency is picked from the top row. For example, if you pick the Japanese Yen from the left column and move along the horizontal line to the US Dollar, the percentage change displayed in the box will represent JPY (base)/USD (quote).
Author

Christian Borjon Valencia
FXStreet
Markets analyst, news editor, and trading instructor with over 14 years of experience across FX, commodities, US equity indices, and global macro markets.














